Last October, around 700 houses in Bengaluru were damaged after heavy rains and flooding. The saga continues this year – 70 houses were flooded on June 4, and more on July 5. For hundreds of low-income families in Bengaluru, heavy rainfall in the last few years have meant intense damage or even losing their home. Flooding can also lead to the inflow of sewage into slums, which further increases the risk of water-borne and vector-borne diseases.
Flooded roads and underpasses don’t just choke traffic for hours, but they also increase the likelihood of accidents. Flooding has also been leading to damage to public infrastructure like stormwater drains.
Do more of these incidents mean Bengaluru is seeing more intense rainfalls? Or is flooding only due to high levels of concretisation in the city, clogged drains, and so on?
The study ‘Climate change scenario in Karnataka: A detailed parametric assessment’ by the Karnataka State Natural Disaster Monitoring Centre (KSNDMC) in June 2020 shows that Bengaluru’s rainfall patterns have indeed been changing and that it is an indicator of climate change.
Increased annual rainfall, varying patterns
The study looked at rainfall data from two periods – 1960-1990 (named P1), and 1991-2017 (P2). It was found that the average annual rainfall in Bengaluru Urban district increased by 13% (or 107 mm – from 836 mm to 943 mm) in the period from P1 to P2.
Across the state, the number of ‘light rainfall’ and ‘very light rainfall’ events also increased in the P2 period. The number of ‘heavy-rainfall days’ did not significantly increase. In Bengaluru, only around one heavy-rainfall day had increased over P2, compared to P1. But what was of concern was that, across the state, the quantity of rain pouring down during these days was much higher compared to earlier. And this was leading to devastating effects like floods.
The intensity of the rainfall has increased in Bengaluru too. With decreasing open space and ineffective stormwater drains, there is little recharge – most of the water is lost as runoff. So flooding has become quite common.
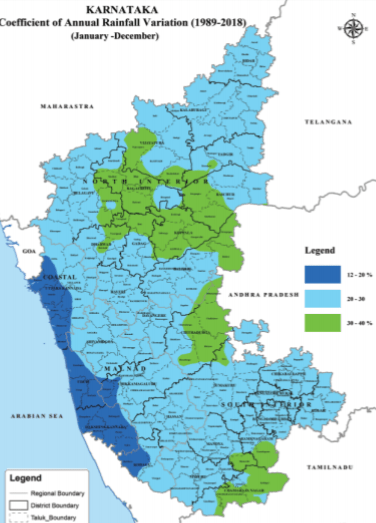
The study also found that Bengaluru Urban was one of the districts that showed high variability in the amount of rainfall across years. An analysis of annual rainfall between 1989 and 2018 showed a ‘co-efficient of variability’ of 25%. That is, in 25% of these years, the amount of rainfall varied; it was either above or below normal. The highest variability was in the month of July – in 62% of the years, the rainfall in July had varied from normal.
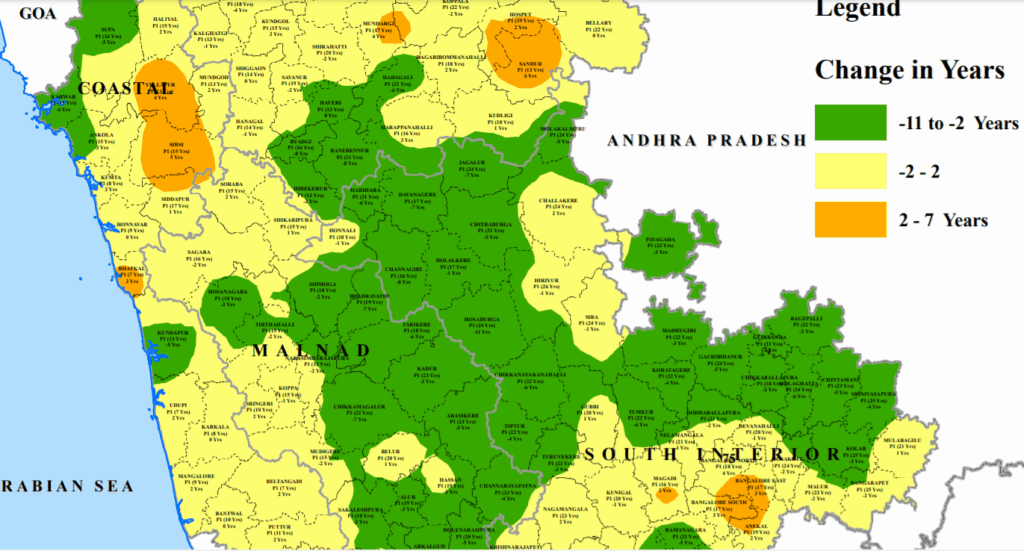
The study also showed that the number of years with dry spells increased during the P2 period. Dry spells are three or more consecutive weeks with less than 50% of normal rainfall. In large parts of Bengaluru Urban, in P2, there were 3-4 more years with dry spells during southwest monsoon. Dry spells affect factors like soil moisture and groundwater levels.
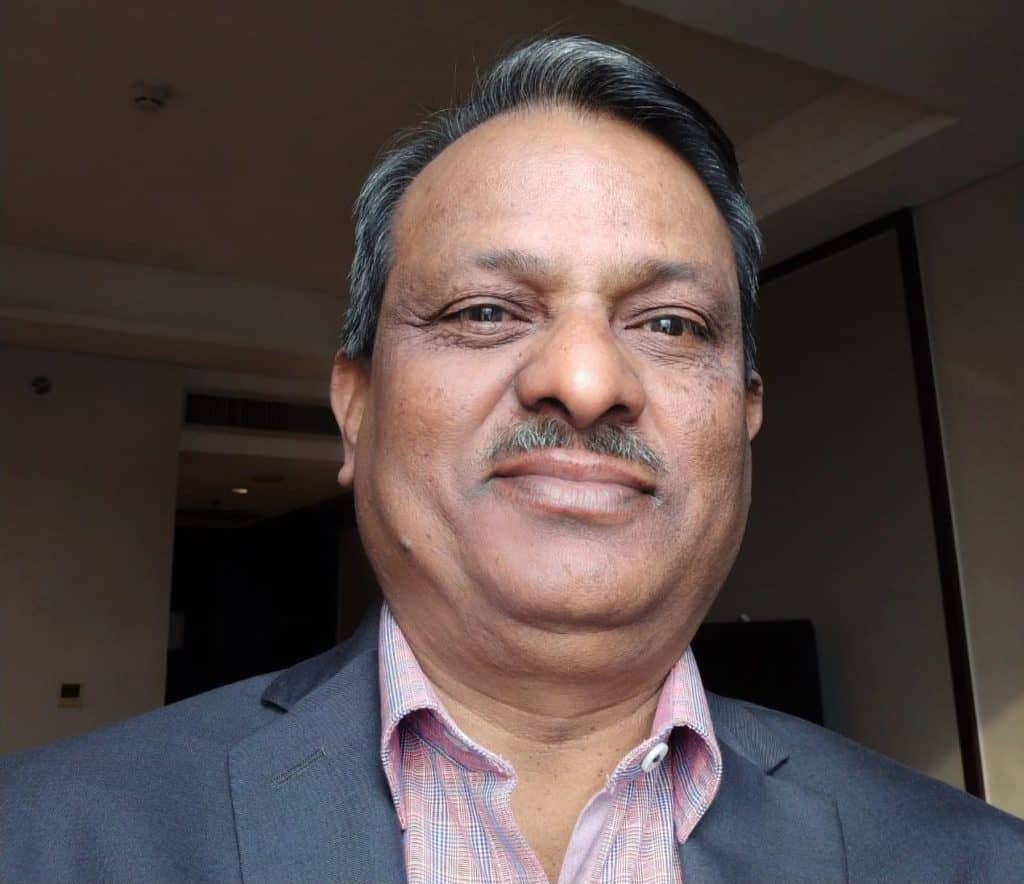
In an interview with this reporter, Dr G S Srinivasa Reddy, former KSNDMC Director who also headed the study, explains the implications for Bengaluru. Dr Srinivasa, a hydrologist, was with KSNDMC for about 30 years. After his retirement last year, he continues to work as a Senior Consultant at the Centre.
Edited excerpts from the interview:
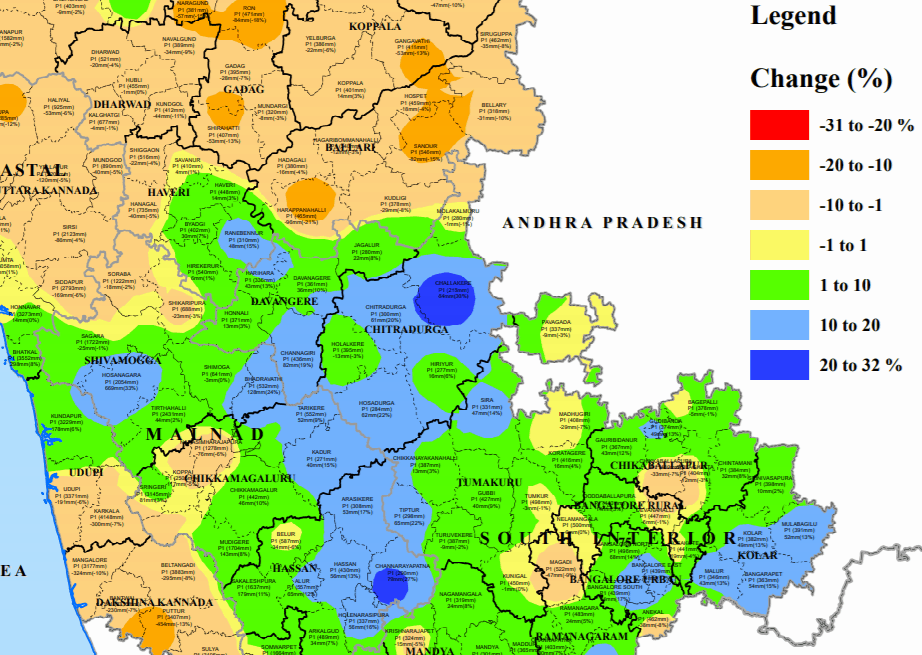
The study shows increasing amounts of rainfall, as well as annual variability of rainfall in Bengaluru.
As per the report, not only Bengaluru, many parts of South Interior Karnataka is showing an increasing trend in rainfall. At the same time, in North Interior Karnataka, the majority of taluks are showing a decreasing trend.
Second thing is, distribution of rainfall has also changed; the frequency of extreme events has been increasing gradually. And there is greater variability in rainfall in Bengaluru over the years.
With urbanisation, the radiation of excess heat in the city contributes to the development of clouds. Pollutants also act as nucleus for the development of droplets of rainfall.
Is there a difference in intensity of rainfall in the city?
Earlier, data from the IMD (India Meteorological Department) observatory on Palace Road, was taken as Bengaluru’s rainfall. In the last three years, we have established about 100 rain gauges across Bengaluru. This network shows that even within the city, rainfall patterns vary; it’s not uniformly distributed across the city. We have been monitoring data since 2013 – if you see these eight years’ data, you will see variability.
Read more: Did Bengaluru really get excess rains in 2020?
Especially the data we have picked up over the last 3-4 years shows that the total number of ‘heavy-rainfall days’ is less, but the amount of rainfall that occurs is not just ‘heavy’, it’s ‘very heavy’. For example, in one station in south Bengaluru, probably in August 2016, 184 mm rainfall was recorded within 24 hours. But the same day, Yelahanka in north Bengaluru got only 8 mm rainfall. So much variability is happening within the city. We also observed that the western part of Bengaluru, especially Kengeri, generally gets more rain.
Is it normal for one area to have so much rainfall and a nearby area to have so little of it? Is that an indication of climate change?
Variability is common, but a variation of 184 mm and 8mm within a short distance of 20 km is huge. These are all gradual impacts of climate change. Even temperatures in the city have been increasing.
We are seeing this not only in Bengaluru, but in the entire state. From 2018 onwards, we have been observing high-intensity rainfall continuously.
If you consider rainfall in Malnad this year, the total amount of rainfall is not much, but there was heavy rainfall within a few days. There were 1-2 heavy rainfall events each in June and July. Suppose 1000 mm of rain is spread over a month, we may not get much runoff. But if it comes within 4-5 days, it creates a lot of runoff.
In Bengaluru also, we have observed that the runoff coefficient has increased. It depends on the land use pattern. Before the 1980s, only 30-40% of the rainfall used to go as runoff. There were more open areas where water infiltrated into the ground and recharged groundwater. But now it’s 85-90% because of urbanisation, as open areas got converted into concrete jungles, and the carrying capacity of stormwater drains reduced due to encroachments/solid waste disposal. So flooding is quite common in urban areas due to the high runoff coefficient, and also the increased intensity of rainfall.
As per the study, Bengaluru doesn’t show much of increase in the number of heavy-rainfall days though.
Yes, in the study we only looked at the number of heavy-rainfall days. That has not increased. But the amount of rain that falls during these days is much higher now. The intensity would be higher in some parts of the city.
Also for Bengaluru Urban district, the study shows more years with dry spells. Is that a concern?
Yes, there are more dry spells, and it’s not good. Extreme events with either more rainfall or less, are the result of climate change.
Read more: Bengaluru’s climate change history and lessons to learn
Bengaluru mainly gets water from Cauvery river. Even the State’s recent water policy indicates that drinking water gets priority. Dam water in Kabini or KRS will definitely be reserved for drinking water in Bengaluru, even as those areas face some drought. Besides, the main catchment for Cauvery water is Kodagu and part of Wayanad (in Kerala), and rainfall has been decreasing in both these districts. In the future, this may affect the inflow coming to Cauvery.
Climate change impacts not only Cauvery, but also groundwater in many parts of Bengaluru which is the drinking water source for many. Already we see that during summer, many borewells are going dry or yielding very little.
What should ideally be the policy decisions from this report? What’s the way forward?
Whatever extreme events are coming, we have to use it as a resource, especially in urban scenarios. For that, we need to implement rainwater harvesting extensively and very systematically, not just for namesake. We get 55-60 days of rain in Bengaluru, spread across 4-5 months. We have to look at how surfaces like pavements can also be used for groundwater recharge. This would help capture floodwater and also help deal with water scarcity during dry spells.
We have to desilt lakes and make sure sewage doesn’t enter them, and then use lake water for purposes other than drinking. Instead of secondary treatment of wastewater, there should be tertiary treatment, and this treated water can also be used for purposes other than drinking. There is definitely scope to use treated water for domestic purposes, by supplying it through dual piping systems.
Recently BBMP started giving AMC (Annual Maintenance Contract) for stormwater drains, which is a good measure to prevent flooding. Under the 15th Finance Commission, the Centre has allotted Rs 50 cr for Bengaluru, among 6-7 cities, for flood mitigation. The Centre is now bringing out the final guidelines on how to use the funds.
Of course, there should be larger plans to deal with climate change as well.
Does this year’s rain show any specific pattern?
It follows the same pattern that we have discussed so far. Rainfall was concentrated in one or two events, with heavy rain and flooding from these events. Otherwise, there has not been much rainfall this year.