For an effective air quality management plan, a lot of information is required at various stages to ascertain the sources, their impacts on health, and their potential to control emissions. However, the most basic information that every city requires is ambient monitoring data. This data tells us, what is the level of air pollution, where and when is it the highest (spatial and temporal trends).
It is very important that the ambient monitoring network for a city is representative, spatially and temporally, to support an effective long-term air quality management plan for the entire airshed of the city. For example, placing ambient monitoring stations at or near traffic junctions or industrial estates could lead to an overestimation; or placing the monitoring stations in parks will lead to an underestimation of the same.
Similarly, collecting data only during the peak hours or peak seasons (often winter months in India) will lead to an overestimation and by taking measurements during the rainy season will lead to an underestimation. In short, we want to be able to have a sample large enough to represent all the commercial, physical, chemical, and meteorological activities that are likely to take place every hour, day, week, month, season, and in a year.
What polluted Bengaluru’s air?
The capital of the state of Karnataka, Bengaluru, is the original “Silicon Valley” of India. As it became a base for information technology (IT) companies in the mid-eighties, its population has grown exponentially and the boundaries of the city have been re-drawn, multiple times, to accommodate the influx of workers, IT campuses, educational institutions, and for people who have made Bengaluru their home. No longer is it a quiet retirement town, rather it is one of India’s youngest bustling metropolises.
With its increase in population and a change in the sectors driving its economy, the city has had to keep up with infrastructure services such as transport and public utilities. A consequence of these rapid changes and poor urban planning is air pollution, in addition to the nuisance caused congestion, open waste burning, and dusty construction sites.
What problem does KSPCB data have?
The Karnataka State Pollution Control Board (KSPCB) operates five continuous air monitoring stations (CAMS) and seven manual monitoring stations within the urban boundary of the city.
- Manual stations measure only PM10, SO2, and NO2 and the procedure includes manually changing and collecting the filter papers, collected on average two times a week, to reach the required minimum of 100 samples per year. The total time of sample collection, time of filter change and collection, filter storage practices, etc., are unknown.
- CAMS are expected to report measurements in real time, every 15 minutes, for all the criteria pollutants and meteorological parameters. This data is available in real time here – an interactive data visualization portal by the Central Pollution Control Board (CPCB, New Delhi, India).
Today, not all stations are reporting the same pollutants or for all the pollutants. For example, of the 5 CAMS and 7 manual stations, only 3 stations report PM2.5 pollution levels. For a city urban airshed spanning 60 km x 60 km with more than 10 million inhabitants – this is not a representative sample.
Bengaluru requires 41 continuous monitoring stations
Our analysis conducted as part of the Air Pollution Knowledge Assessment (APnA, 2017) for 20 Indian cities, estimates that Bengaluru city’s urban airshed requires at least 41 CAMS to spatially and temporally represent its pollution levels. For comparison, there are 110+ and 60+ CAMS operational in London and Paris, respectively, reporting data in real time to support pollution alerts in the city. Data from this dense network of stations is also utilised to produce near-term pollution alerts in London and Paris.
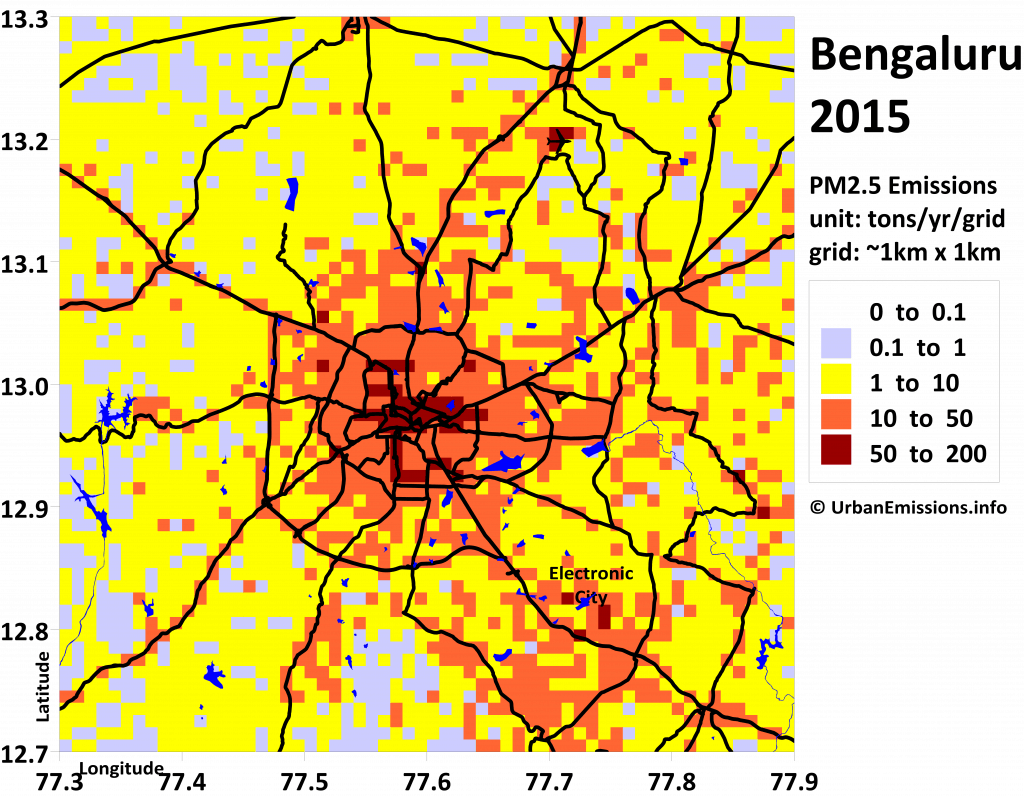
Estimated PM2.5 emission distribution in Bengaluru city’s urban airshed (from APNA city study, 2017)
Ideally, we would like these monitoring stations to be regulatory grade, in accordance with the protocols suggested by CPCB, covering all the criteria pollutants and the meteorological fields. The costs involved in procuring the right equipment, site preparation, site maintenance, equipment maintenance, and data management, are not cheap, and this factor often tends to delay the expansion process.
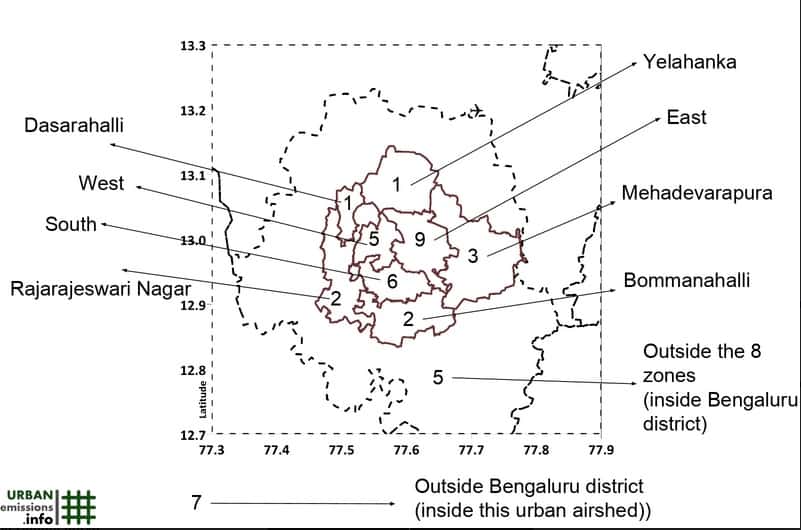
Estimated number of continuous monitoring stations required in Bengaluru city’s urban airshed (from APNA city study, 2017)
Non-governmental data can help fill the knowledge gap
While we are waiting for the official monitoring capacity to develop, there is also room for non-governmental, academic, and concerned groups to support this activity in various forms and this could get cheaper with better understanding of the pollution sources, key pollutants, and alternative technologies.
- Key pollutant in Bengaluru, like in other Indian cities, is particulate matter (PM in 2.5 and 10 μm sizes). All combustion sources burning coal, petrol, diesel, gas, wood, cow dung, and waste, contribute to PM2.5 size fraction. Most of the wind-blown dust from the construction sites and re-suspension on the roads contributes to PM10 size fraction.
This does not mean that other pollutants are not important. This only means that PM2.5 and PM10 are the key pollutants, often exceeding the ambient standards, and there is more to gain from these pollutants at more locations and more often, than the other pollutants. There are reference grade equipment available (example), which measure only PM size fractions. This will also cut the equipment and operational costs significantly – the monitoring network can be dispersed with some stations to measure all pollutants and some stations to measure PM only. - Today, alternative sensors, at lower costs than the regulatory grade monitoring equipment, are also available to increase the pool of monitoring data. In general, these alternative sensors can help create a faster and cheaper heat map of the pollution levels in the city; can help reach the parts of the city, which are not possible to reach using standard monitors; and can also aide in creating public awareness on the ill effects of air pollution due to chronic exposures.
However, if the data is meant to support long-term air quality management plans for the city, this data should be analysed with caution, and utilised only if the equipment passes the required calibration and maintenance protocols. It is very important to note that every monitor, whether it costs INR 1 crore or INR 10 thousand, requires the same level of maintenance and scrutiny for data; and if the equipment is not maintained, calibrated, and checked for quality from time to time, it is as good as scrap metal.
KSPCB announced that the Bengaluru city will get five new continuous monitoring stations in 2018, which is a step in the right direction, but it is still not enough to represent the city’s polluting activities.