Citizens of Mahadevapura and East zones, including Bellandur and Whitefield area are up in arms against the system that surrounds them. They pay taxes every year, but the infrastructure around them is broken. They have to fight with the system everyday for everything: good roads, clean water, garbage disposal, pollution, traffic problems and more.
There is a good amount of citizen activism in the area where there is a presence of well-educated people employed in various corporates. However, the issues don’t get sorted as quickly as they should.
This brings us to the question: how did a part of the city end up becoming like this? How much tax does the area pay actually? And what does it get in return?
Check this graph: It tells you what exactly is happening.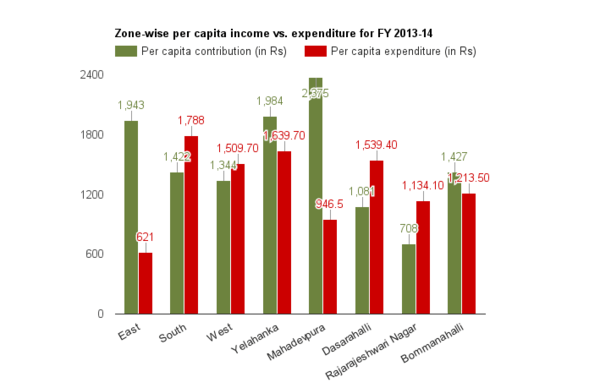
Graph of tax per head v/s funds allocated by BBMP per head, for 2013-14. East and Mahadevapura zones contributed more tax but received less allocation compared to others.
Mahadevapura, East zones get less per capita allocation
Fed up of the poor infrastructure and slow pace of work that goes into providing it, Whitefield Rising, a community group in Whitefield, has called for Black Fridays – where people will wear black dresses to express their protest against the status quo. This will be a part of the Whitefield Bachao andolan the group will be spearheading.
An analysis of property taxes paid across the city and the budget allocation for each zone, done by Citizen Matters confirms the trend: that Mahadevapura usually got an allocation per capita, that was less than per capita tax paid in the zone.
When one looks at the allocation per ward, it certainly looks huge and better than many other zones. However, when the population in the wards is considered, allocation per head goes down.
The shorter blue bars and bigger purple bars in the below graph for 2014-15 indicate the continued allocation higher than the property tax paid for all other zones, except Mahadevapura zone. Property tax is not the only tax paid by the people in an area, or the only source of income for the government. But it gives an idea of the income that can be generated in that area.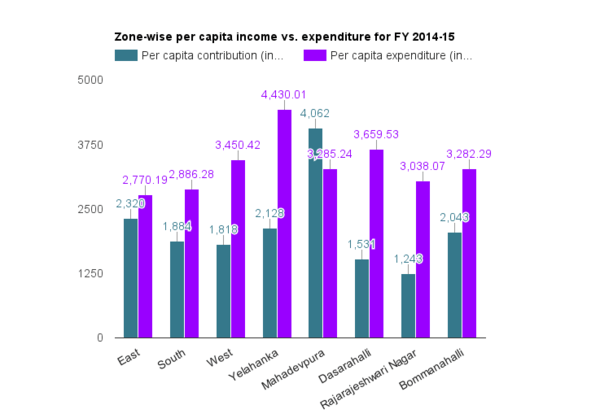
Graph of tax per head v/s funds allocated by BBMP per head, for 2014-15. Mahadevapura zone continued to contribute more tax but received less allocation.
In the tables below, the financial allocation for each zone is a combination of ward level allocations and zone level allocations. It excludes project-specific funds from the State and Central governments (JnNURM), such as those meant for flyovers and water projects. It also excludes revenue expenditure for the city set aside in the budget.
According to the statistics collected, East zone has contributed highest property tax with the total collection of Rs 927.42 crore in two years three months. However, the funds allocated to East Zone was only Rs 781 crore in the three years.
Mahadevapura zone has contributed a property tax of Rs 720.51 crore and got an allocation of Rs 577.96 crore. In contrast, the West zone collected a tax of Rs 619.51 crore but got an allocation of Rs 1119.81 crore in last three years. Rajarajeshwari Nagar contributed Rs 190 crore and Dasarahalli a mere Rs 144 crore.
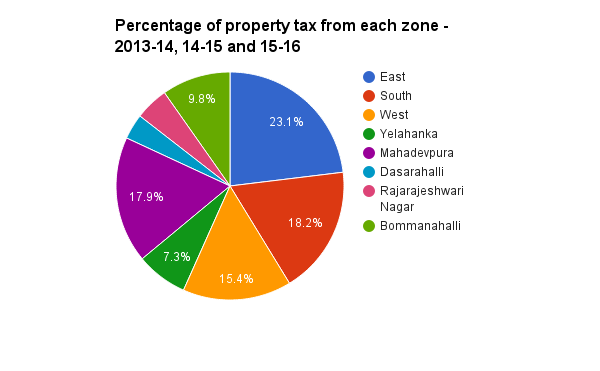
Percentage of total property tax collected from various zones in BBMP for 2013-14, 2014-15 and 2015-16.
The graphs for 2013-14 and 2014-15 show that contribution of tax per head is higher for Mahadevapura and East zones, while the money allocated by the BBMP per head is low compared to other zones, and way below the tax paid.
Zone-wise property tax collection in BBMP during the financial year 2013-14, 2014-15 and 2015-16:
|
Zone |
No. of wards in each zone |
Population (as per 2011 census) |
Property tax collected in 2013-14 (in crores) |
Property tax collected in 2014-15 |
Property tax collected in 2015-16 (as on 23-05- 2015) |
Total zonewise |
|
East |
44 |
16,84,175 |
327.24 |
390.83 |
209.05 |
927.12 |
|
South |
44 |
16,56,072 |
235.52 |
312.09 |
183.22 |
730.83 |
|
West |
44 |
15,81,717 |
212.71 |
287.59 |
119.21 |
619.51 |
|
Yelahanka |
11 |
5,45,799 |
108.34 |
116.18 |
68.63 |
293.15 |
|
Mahadevpura |
17 |
8,78,991 |
208.78 |
357.08 |
154.65 |
720.51 |
|
Dasarahalli |
8 |
4,45,604 |
48.20 |
68.25 |
28.03 |
144.48 |
|
Rajarajeshwari Nagar |
14 |
7,42,411 |
52.62 |
92.35 |
45.52 |
190.49 |
|
Bommanahalli |
16 |
9,08,906 |
129.77 |
185.76 |
76.34 |
391.87 |
|
Total |
198 |
84,43,675 |
1,323.18 |
1,810.13 |
886.65 |
4,019.96 |
Zone-wise property tax collection, funds allocated, per capita and per ward contribution and allocation details for the year 2013-14:
|
Zone |
Total number of wards |
Property tax collection in 2013-14 (in crores) |
Per ward contribution in crores (on an average) |
Per capita contribution (in Rs) |
Funds allocated (in crores) |
Per ward allocation in crores (on an average) |
Per capita allocation (in Rs) |
|
East |
44 |
327.24 |
7.43 |
1,943 |
104.6 |
2.37 |
621 |
|
South |
44 |
235.52 |
5.35 |
1,422 |
296.2 |
6.73 |
1,788 |
|
West |
44 |
212.71 |
4.83 |
1,344 |
238.8 |
5.42 |
1,509.7 |
|
Yelahanka |
11 |
108.34 |
9.84 |
1,984 |
89.5 |
8.13 |
1,639.7 |
|
Mahadevpura |
17 |
208.78 |
12.28 |
2,375 |
83.2 |
4.89 |
946.5 |
|
Dasarahalli |
8 |
48.20 |
6.02 |
1,081 |
68.6 |
8.57 |
1,539.4 |
|
Rajarajeshwari Nagar |
14 |
52.62 |
3.75 |
708 |
84.2 |
6.01 |
1,134.1 |
|
Bommanahalli |
16 |
129.77 |
8.11 |
1,427 |
110.3 |
6.89 |
1,213.5 |
|
Total |
198 |
1323.18 |
6.70 |
1,567 |
1071.48 |
5.41 |
1,268.9 |
Zone-wise property tax collection, funds allocated, per capita and per ward contribution and expenditure details for the year 2014-15:
|
Zone |
Total number of wards |
Property tax collection in 2014-15 (in crores) |
Per ward contribution in crores (on an average) |
Per capita contribution (in Rs) |
Funds allocated (in crores) |
Per ward allocation in crores (on an average) |
Per capita allocation (in Rs) |
|
East |
44 |
390.83 |
8.88 |
2,320 |
466.55 |
10.60 |
2,770.19 |
|
South |
44 |
312.09 |
7.09 |
1,884 |
477.99 |
10.86 |
2,886.28 |
|
West |
44 |
287.59 |
6.53 |
1,818 |
545.76 |
12.40 |
3,450.42 |
|
Yelahanka |
11 |
116.18 |
10.56 |
2,128 |
241.79 |
21.98 |
4,430.01 |
|
Mahadevpura |
17 |
357.08 |
21 |
4,062 |
288.77 |
16.98 |
3,285.24 |
|
Dasarahalli |
8 |
68.25 |
8.53 |
1,531 |
159.06 |
19.88 |
3,659.53 |
|
Rajarajeshwari Nagar |
14 |
92.35 |
6.59 |
1,243 |
225.55 |
16.11 |
3,038.07 |
|
Bommanahalli |
16 |
185.76 |
11.61 |
2,043 |
298.33 |
18.64 |
3,282.29 |
|
Total |
198 |
1810.13 |
9.14 |
2,143 |
2,703.8 |
13.65 |
3,202.16 |
Information source:
- Total property tax collected during the year 2013-14, 2014-15 and 2015-16 (till May 2015): Revenue section, BBMP
- Funds allocated to each zones in 2013-14, 2014-15 AND 2015-16: Janaagraha Centre for Citizenship and Democracy
The Bruhat Bengaluru Mahanagara Palike (BBMP) that is supposed to address the civic issues has always claimed the shortage of funds. Though property tax is not the only source of revenue for BBMP, it is the largest chunk. Advertisements, service tax, rent from BBMP markets, state funds and other fines or penalties add smaller amounts to its coffer. The shortfall (up to 30 % this year) is managed with the help of state government grants and loans from banks.
There are two arguments on the distribution of wealth in a territory. First one says that the wealth should be redistributed and poor areas must be developed with the wealth generated in rich areas. Another argument says that the wealth generated in one area must be used in the betterment of that particular area.
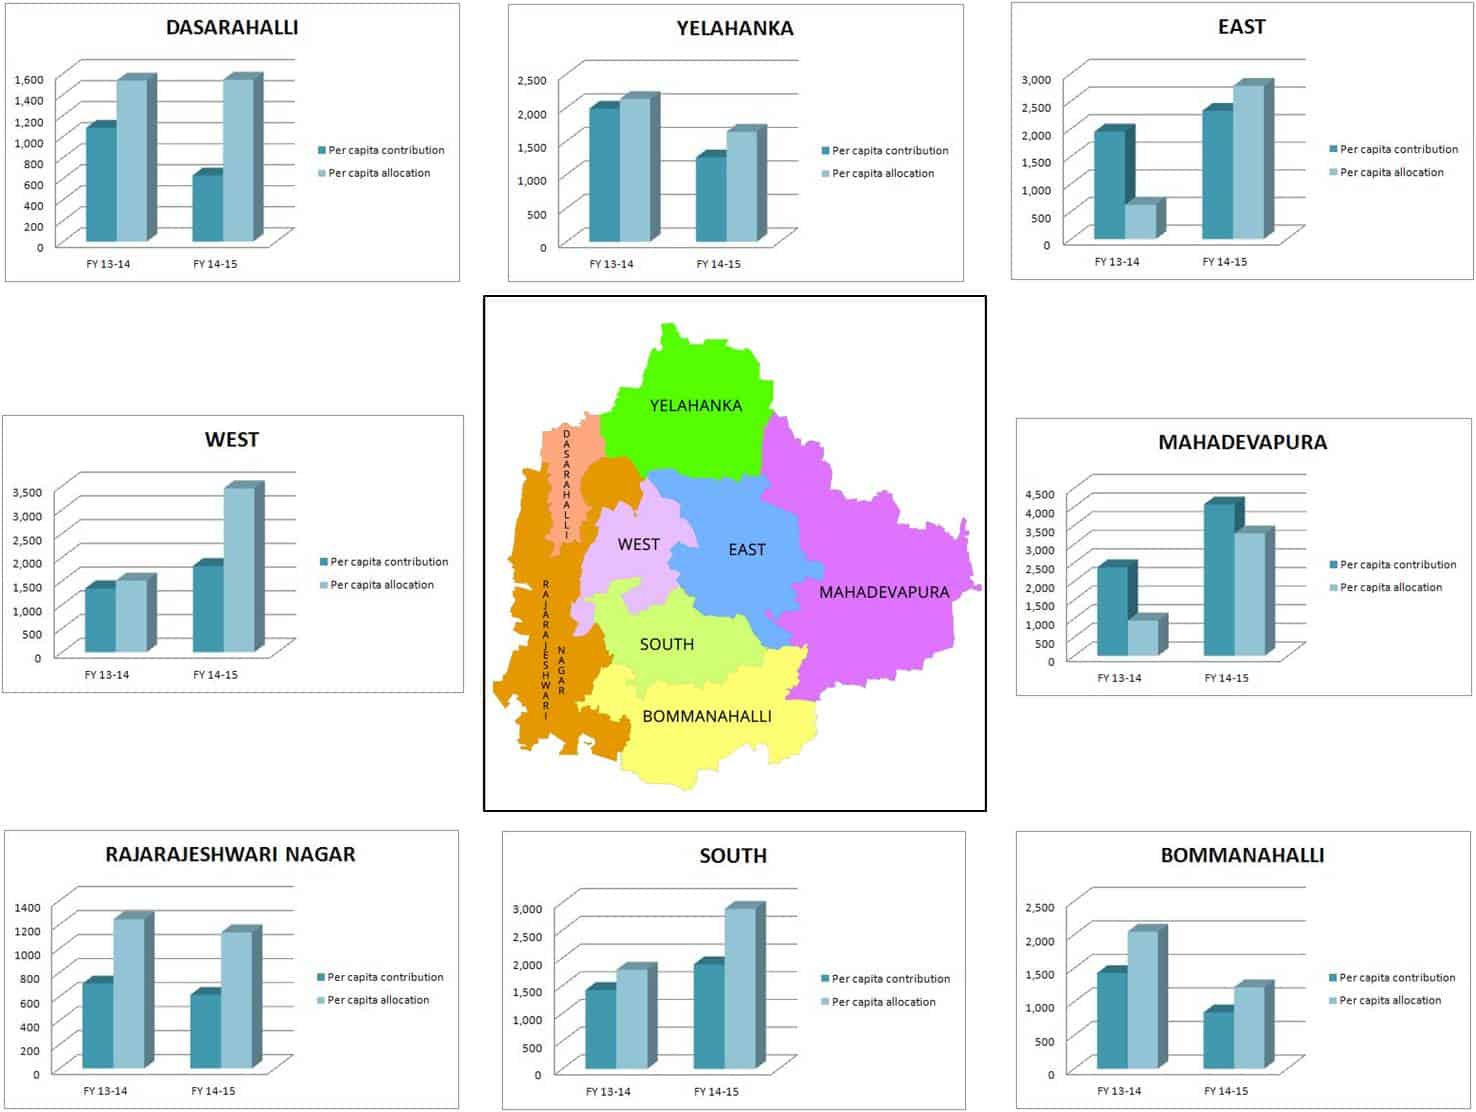
Zone-wise representation of tax paid vs. funds allocated. Click on the image to enlarge.
Will Whitefield go for ‘First infrastructure, then tax’ campaign?
What is happening in Bengaluru is “redistribution” of wealth from one area to another, without providing necessary infrastructure in the area that generates wealth. And this is exactly what is causing the heartache to the citizens of “wealthy” areas, such as Whitefield.
One can recall that West zone and Rajarajeshwari Nagar zone were involved in the infamous Rs 1,439 crore fake bill scam a while ago, which is yet to reach a logical conclusion, with its investigation shifting from one agency to another. When the money collected in one area gets misused in another area and no work happens in the area where the tax was paid, what are the options that the citizens have?
R K Misra, a civic activist living in Whitefield, gives voice to the frustration of the taxpayers in Whitefield and the surroundings. He asks why the people in Whitefield should pay taxes. He says in a facebook post:
“I was reading Indian Freedom Struggle (Amar Chitra Katha version) last evening…of all protests only which hurt British was SALT making & Quit India – Boycott of their goods. Hit where it hurts economically.
Mahadevapura paid 600 Cr+ of BBMP taxes & we got less than 10% in return last year for our completed infra projects. So, should we pay taxes to fund infrastructure of other parts of BLR and live in misery or put a hold on payment till we get infrastructure and then pay…”
Will the citizens here resort to this mode of protest, to get the basic infrastructure for the area in place? Will it make any impact? Only time will tell.
Data and graphics inputs from Nikita Malusare, Akshatha M and Ganga Madappa.
Related Articles
Be diligent with those property papers
BBMP beats drums in front of property tax defaulters’ homes
Be careful while buying an under-construction property
Here’s why BBMP Khata is not a proof of ownership for your property
Six things that can stop you from falling for shady property deals
come elections and the RTI mafia raises its head to obstruct development work and harassing citizens, extortion, may be with passive blessing of the …….