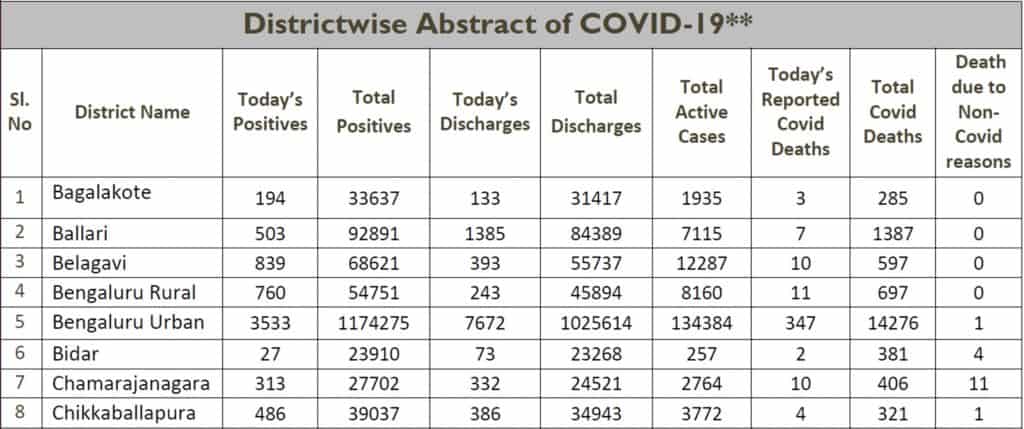
During the first week of June 2021, the daily bulletin from the Department of Health and Family Welfare(DHFW), Karnataka, was still reporting 300+ COVID deaths per day for Bengaluru Urban district. The corresponding daily positives was around 3500-4000. The general feeling was that the worst was over and things had eased up. But these numbers suggested otherwise, a fatality rate of close to 10%!
A closer look at the “DOD” (Date of Death) column of Annexure-2 of the bulletins, however, showed that a lot of these 300+ COVID deaths were being back-counted from May, and some even from April. For instance, June 3rd recorded 347 deaths for Bengaluru Urban, of which only 31 had occurred in June, 286 in May, and 29 in April. If you’re wondering why the total is one short, that is because there was one death counted all the way from March! Given this level of back-counting, calculation of fatality rate as the number of COVID deaths divided by the number of positives gets tricky.
Read More: The fall and rise of COVID test numbers in Bengaluru
The approach I’ve taken is to sift through the daily bulletins and BBMP updates. More specifically:
1. Daily positives are derived from the DHFW bulletins for Bengaluru Urban, from the “Today’s Positives” columns.
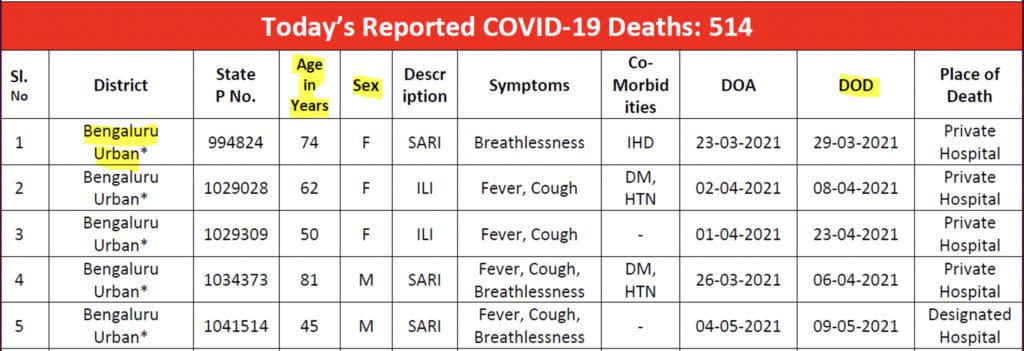
2. Parameters like Age, Sex and DOD pertaining to Bengaluru Urban deaths are pulled out from Annexure-2 of the bulletins.
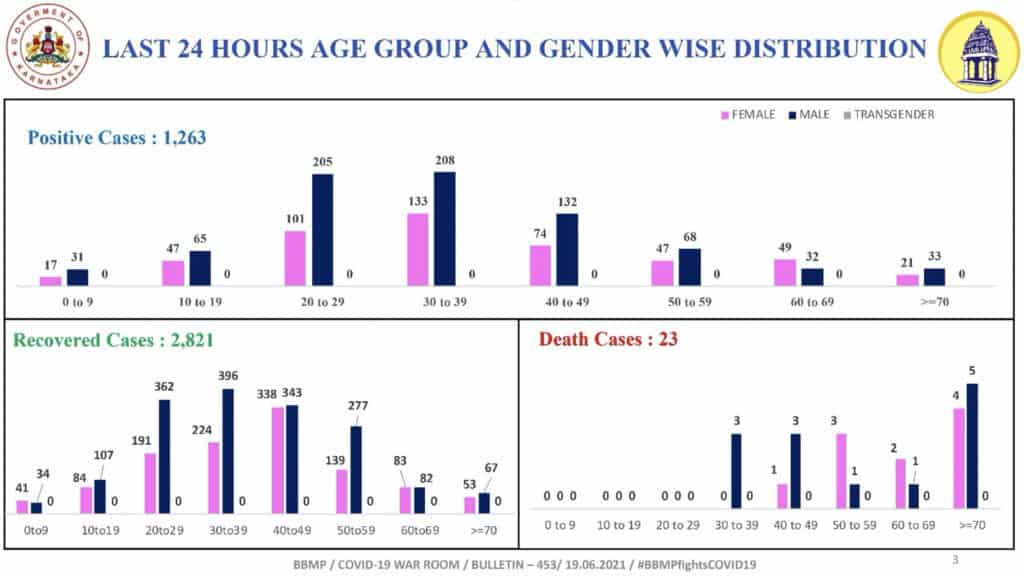
3. BBMP puts out a daily bulletin where the age-wise split of daily positives is given:
Based on these sources, we can try to form an idea of how severe the second wave was across the months of April and May, and if we are seeing any improvements in June.
For the sake of clarity, “recorded” refers to the deaths reported on a particular date in the bulletin (District wise abstract above) which could include significant back-counting, and “occurred” will mean the COVID deaths that happened on that date as per the DOD column in the daily bulletin (Annexure 2 above).
Read More: COVID vaccination: Expert agrees with ‘First dose fast’ policy
April death rate: 1.07%
April started with the numbers rising, but they did not foretell the carnage that was to come at the peak. April 1st recorded 2906 cases and 11 deaths. By the 30th of April, this had risen to 26756 cases and deaths recorded were 93. In total, April recorded 321913 positives and 1756 deaths. Again, by recorded I mean the number of deaths in the ‘Total COVID Deaths’ column in the district wise report, not “occurred”. This seems to suggest a Fatality Rate of around 0.55% which looks not so bad at all.
But, a deeper dive into the DODs in the daily bulletin (Annexure 2) paints a different picture. Of these 1756 deaths, 1682 actually occurred in April and the rest were from March. As May unfolded, many of the deaths were seen to have occurred in April (as per the DOD figures). This back counting kept pushing up the number of deaths in April.
The past couple of weeks have not added any deaths to April, and the total deaths that occurred in April (as per DOD figures) now stands at 3458, almost double the 1756 and more than double the 1682 that we get from the daily bulletins. This moves the CFR to 1.07%, which is nowhere in the range of 0.55%.
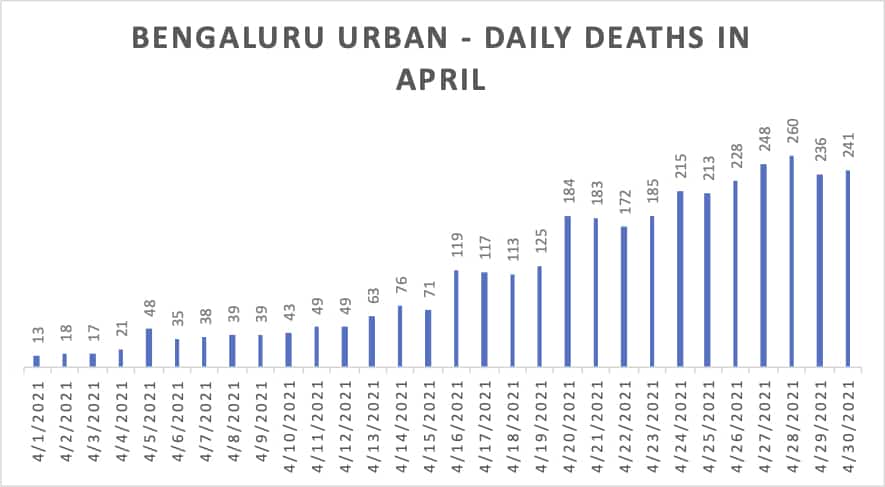
As the number of cases rose, the number of COVID deaths found to occur each day also increased, eventually reaching a high of 260 deaths occurring on the 28th of April.
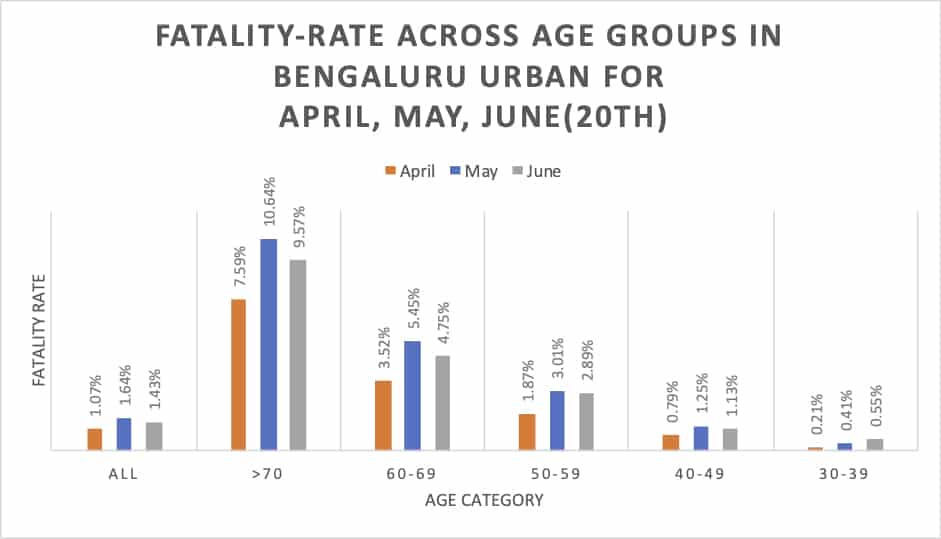
In terms of age-wise fatalities this is how things stacked up:
| Age brackets | Total Positives | Deaths | Proportion of Positives | Proportion of Deaths | CFR |
| Total | 321913 | 3458 | — | — | 1.07% |
| >70 | 15843 | 1203 | 4.92% | 34.79% | 7.59% |
| 60-69 | 24780 | 872 | 7.70% | 25.22% | 3.52% |
| 50-59 | 37770 | 706 | 11.73% | 20.42% | 1.87% |
| 40-49 | 55395 | 437 | 17.21% | 12.64% | 0.79% |
Age-wise split of positives is obtained from BBMP’s daily bulletins, while those of deaths from the Age column of death records in the DHFW bulletins (as seen in the Annexure 2 details).
May death rate: 1.64%
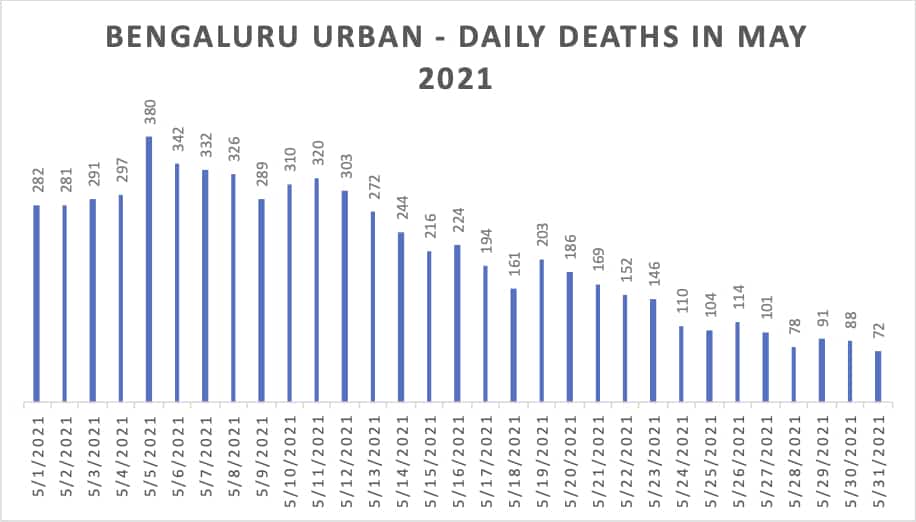
May continued from where April left off, starting with 19353 cases for Bengaluru Urban, but peaking around May 6th. By May 31st the number of positives had dropped down to 3992. On May 1st, daily recorded deaths stood at 162, while on May 31st, 242 deaths were recorded. The highest recorded was 374 deaths on May 10th.
In total, May recorded 406489 positives and 6977 deaths. Again, the deaths here are recorded deaths, which include significant back-counting. Taking such back-counting into account, the Fatality Rate showed a value of 1.71%!
Diving deeper into the DODs paints a different picture. Of the 6977 deaths recorded in May, 1776 were from April. June added more cases to May from the initial weeks, and the tally of deaths that occurred in May now stands at 6678, giving a CFR of 1.64%. Though not as bad as the 1.71% initially suggested, this is significantly worse than the 1.07% in April!
The healthcare facilities we had in April were the same we had in May, so this increase in the Fatality Rate can be attributed entirely to an overwhelmed healthcare system. In terms of the deaths that occurred daily, the first two weeks of May were very bad, averaging 300+ deaths a day! May 5th was the worst, with 380 deaths occurring, as of writing this article.
In terms of age-wise fatalities this is how things stacked up. I added a row for 30-39 as a significant number of deaths seemed to be getting recorded for that age group:
| Age Brackets | Total Positives | Deaths | Proportion in Positives | Proportion in Deaths | CFR |
| Total | 406489 | 6678 | — | — | 1.64% |
| >70 | 20212 | 2148 | 4.97% | 32.17% | 10.63% |
| 60-69 | 30893 | 1684 | 7.60% | 25.22% | 5.45% |
| 50-59 | 45713 | 1376 | 11.25% | 20.60% | 3.01% |
| 40-49 | 73341 | 915 | 18.04% | 13.70% | 1.25% |
| 30-39 | 106247 | 440 | 26.14% | 6.59% | 0.41% |
A comparison with April will be done at the end, along with that of June data. But what we can see here is very distressing. The CFR for those aged 70+ went over 10%. Almost 1 in 9 of those infected, over 70 years of age, died of COVID. The CFR of those aged 40-49, which is not considered a high-risk group, also shot up to 1.25%. One cannot help but wonder how many of these deaths could have been avoided with timely availability of healthcare and oxygen.
June death rate: 1.43%
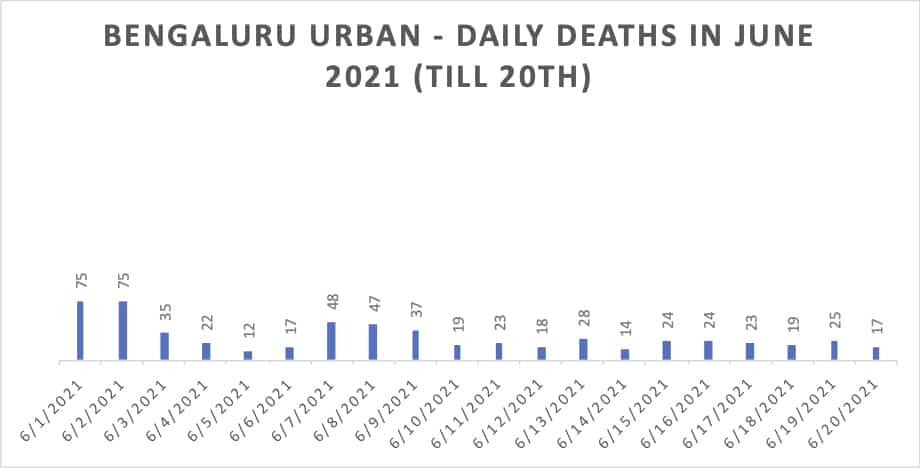
Given that June is ongoing and deaths are currently back-counted by a few days, 20th June looks like a good place to pause. All data for June cited below will be till the 20th of June. June started with 3418 cases and 276 recorded deaths on the 1st. June 20th recorded 933 cases and 12 deaths. For 20 days, June has recorded 42030 cases and 2099 deaths which suggests a Fatality Rate of 5.00%!
However, as I’ve mentioned earlier, a lot of the deaths recorded during the first week of June are actually deaths that occurred in May.
Counting only those deaths that occurred between June 1st and 20th gives us 602 deaths for a Fatality Rate of 1.43% which is nowhere close to 5.5%, but is still significantly worse than April’s 1.07%. We’re better off than we were in May, but not quite at April levels. Not sure what is happening, but a deeper dive should tell us more?
In terms of COVID deaths occuring per day, we started in the 70s and averaged around 20 deaths per day towards the end of the period.
How do the age-wise fatalities stack up, up to 20th June?
| Age Brackets | Total Positives | Deaths | Proportion in Positives | Proportion in Deaths | CFR |
| Total | 42030 | 602 | — | — | 1.43% |
| >70 | 2017 | 193 | 4.79% | 32.06% | 9.57% |
| 60-69 | 2926 | 139 | 6.96% | 23.09% | 4.75% |
| 50-59 | 4046 | 117 | 9.62% | 19.44% | 2.89% |
| 40-49 | 7052 | 80 | 16.77% | 13.29% | 1.13% |
| 30-39 | 11011 | 61 | 26.19% | 10.13% | 0.55% |
The CFR across age-groups has declined compared to May, but it is still not at the same level as April. The cause is not clear. The CFR for those in the 30s seems to have risen from 0.41% in May to 0.55% in June!
The proportion in deaths shows a decline for those in the 60s, but remains more or less the same as in May for the other age brackets. Although it could be attributed to vaccinations, it can also be because of the increase in fatality rate in the younger age cohorts.
Putting it all together
As the cases started to climb in March, we knew we were in for the Second Wave. But the scale of it was not anticipated and it has left behind what can only be called a carnage. Even though things seem to be settling down now, and facilities are much more easily available, the fatality rate still looks much higher than what it was in April.
Proportion of deaths by age-group:
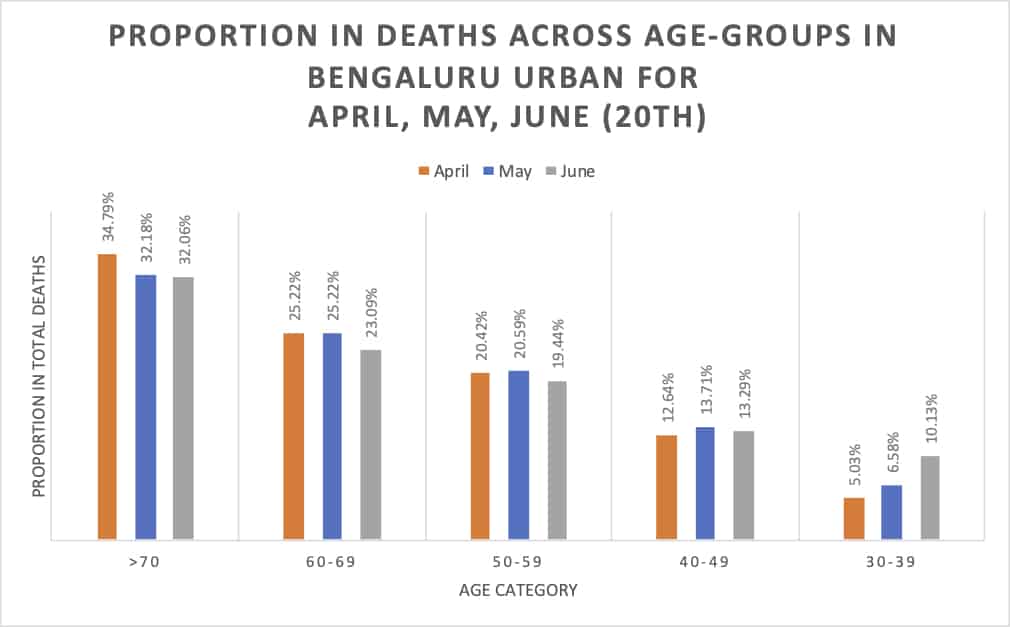
The key changes are in the 70+ age category where since April, the proportion seems to have fallen, and in the 30-39 age category, where it seems to be rising, which seems to suggest a higher percentage of deaths in younger cohorts! This correlates with the increase in fatality rate by 25% in the 30-39 age category seen between May and June. Does this suggest that the virus is becoming more harmful for younger groups now?
Even though we seem to be in a break between waves, the fatality rate is still cause for concern. The imperative should be on vaccinating as many people as possible in the next few months. Lockdowns in some form or the other are likely to continue for the rest of the year. Given the concern with variants and effectiveness of vaccines against them, we will need to continue maintaining the discipline learned over the past year, of wearing masks and avoiding crowded places, even after being vaccinated.
It needs to be mentioned again that the numbers here are all derived from official bulletins. The death numbers are most likely an undercount. Whether this will affect fatality rates is tricky to predict, as we will also need to estimate the true number of positives, not just those who got tested. True accounting will also involve ascertaining excess deaths that happened in April and May 2021, as compared to earlier years – 2018, 2019 and 2020.
One also wonders what a better health infrastructure could have achieved and how many deaths could have been prevented. Even targeting a Fatality Rate of 1.00%, we could have prevented 2600 deaths in May, officially. Let us hope that the right lessons have been learnt and we’ll be ready to face the third wave when it happens.