For urban planners, visualising a city’s growth requires determining the extent and nature of urbanisation that the city has and is experiencing. While satellite imagery is often relied on for comprehending the built growth, this data does not provide insights on what is the ‘nature’ of the built form: i.e. residential, commercial, industrial, among others.
Unscrambling the data on building plan sanctions can potentially bridge this gap in understanding.
In urban areas, the built growth or construction of buildings is managed and monitored by local bodies through its Town Planning Department, the first of such management being sanctioning a building plan.
For Bengaluru, the process of sanctioning building plans is digitised and the data generated is in the public domain on the municipal (BBMP) website. This dataset elucidates the nature of the built form that the BBMP is sanctioning within its jurisdictions, in accordance with the Zoning Regulations of Revised Master Plan-2015 and the Building Byelaws (2003) (Published in pursuance of Section 428 Of the Karnataka Municipal Corporation Act 1976).
Notably, sanctioning of building plans outside the BBMP but within the planning authority’s jurisdiction is the responsibility of the planning authority – in this case the BDA. The BDA is also the sanctioning body for all developments above five acres within the BBMP jurisdiction.
However, this data is neither available in a digital format, nor is it available in the public domain. In other words, the BBMP dataset on:
- Sanctioned building plans
- Commencement certificates issued
- Occupancy certificates
are not the complete story on the nature and quantum of development that Bengaluru is witnessing.
Yet, it is a starting point to understand how the city is growing and the nature of this growth.
Here we analyse the publicly available datasets to articulate the findings in a two-part series. In this, the first of the series, we discuss the quality of datasets and the emerging imperative of streamlining these given their potential in informing, visualising and guiding the built-growth in the city. In the second part, we will discuss the relevance of and findings of this data.
That this data has been put in the public domain is a laudable initiative of the BBMP. Yet, much needs to be done to make it useful.
Read more: BBMP checks no village maps or master plan, while sanctioning plans
Building plan sanction process in Bengaluru
Building plans within the BBMP are sanctioned as follows:
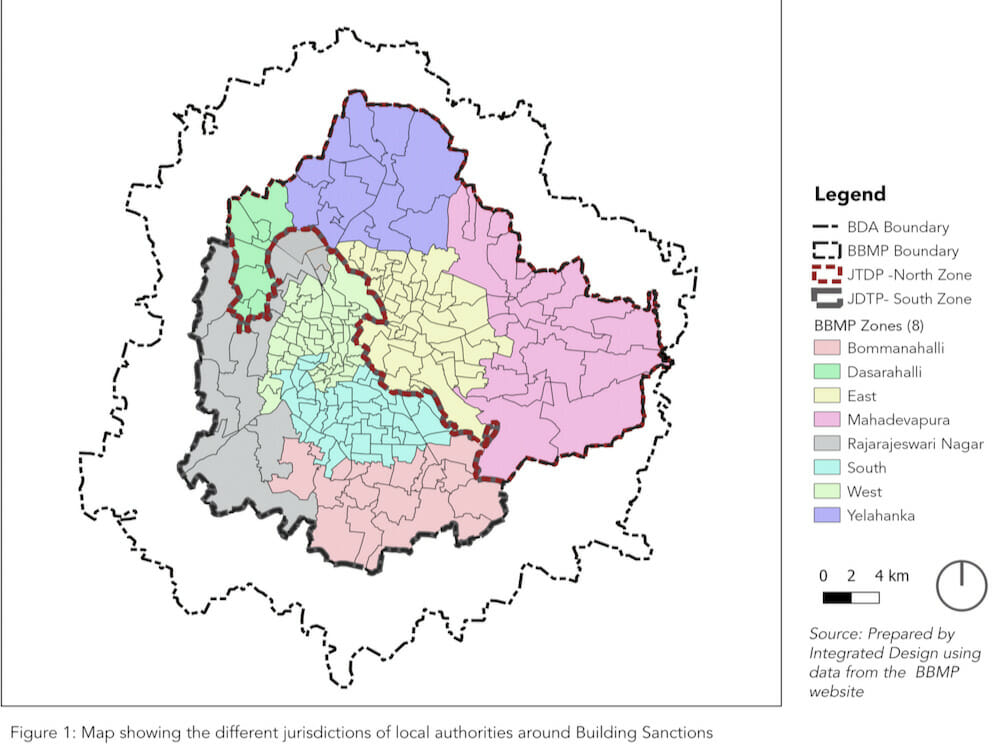
- Plans for buildings that are four floors and above are sanctioned at the BBMP headquarters by the office of the Joint Director of Town Planning (JDTP) for two divisions:
- North (includes the BBMP zones of Yelahanka, East, Mahadevapura and Dasarahalli)
- South (South, Bommanahalli, R.R. Nagar and West)
- For buildings with less than four floors, building plans are sanctioned by the Assistant Director of the Town planning Department (ADTP) at eight zonal offices.
- In addition, for residential areas upto 4,000 sq. ft, the sanction is handled by the online portal Suvarna Parvanige and is processed between 3 and 10 days from the inward date of application.
- Single dwelling residential buildings in sites upto 2,400 sq.ft. are handled through the Sakala Services and are managed by Sub-divisional offices of BBMP. However, this service is not digitised.
The Sakala provides guarantee of services to citizens in the State of Karnataka within the stipulated time limit and for matters connected therewith and incidental thereto (The Karnataka Sakala Services Act, 2011 and (Amendment) Act, 2014)
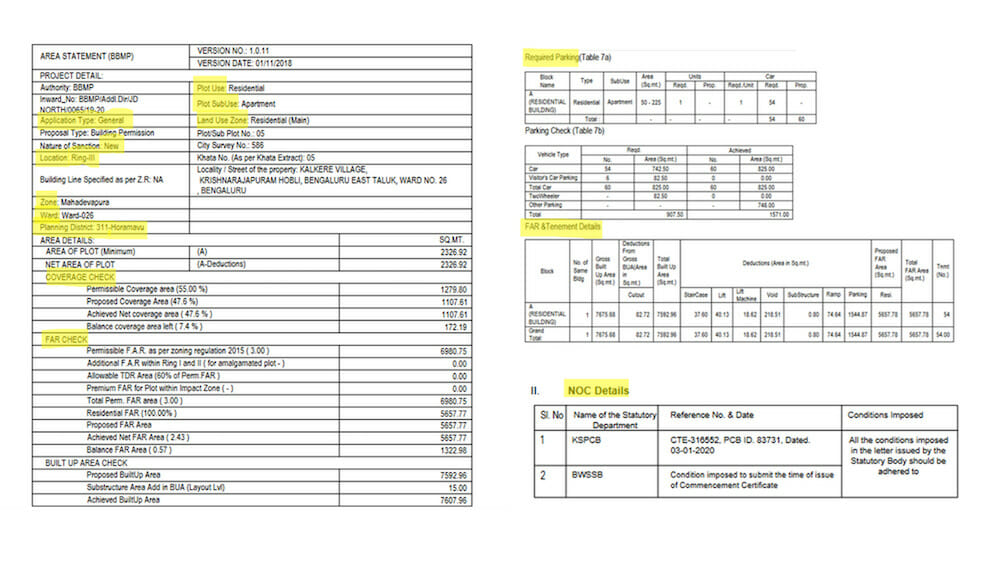
The online application mandates the following:
- Inward Date or the date the plan was received for approval
- The plan of the building which can be for a new building or modifications to an existing building
- The location details of the building: address, ward number, BBMP zone, planning district, whether it lies in Ring I, II or III
- The use that the plan is allocated for – Residential, Hostel building, Commercial establishment and other
- Floor Area Ratio (FAR) permissible as per the RMP 2015 and to be utilised
- For buildings that are four floors and above, the following are required to be furnished: Parking provisions and the NOCs from the Fire Force Department, Airport Authority, SEIAA (Social Environmental Impact Assessment), BESCOM, BSNL, KSPCB, BWSSB, and Defense Authority.
Three rings were proposed in the Revised Master Plan 2015 to guide the city’s development – Ring I (inner core areas), Ring II (Areas with developed urban areas) and Ring III (Urban extension area in city outskirts)
While the data points that the online application collects are useful in comprehending the nature of built form in the city, in effect, these datasets in the current form are of little use.
To facilitate analysis and mapping, the publicly available data for JDTP North and South as well as ADTP (South, Bommanahalli, East, Yelahanka and Mahadevapura) for 2011 – 2022 was collated year-wise in an Excel format.
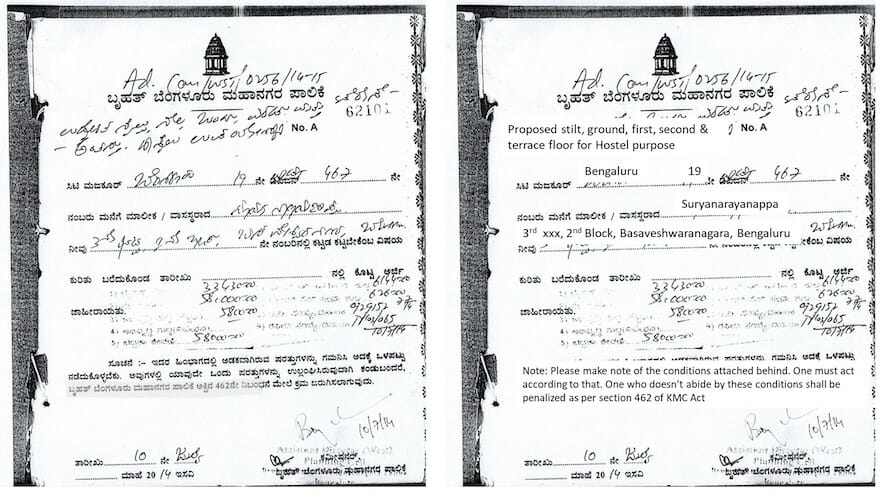
The ADTP data for the West, RR Nagar and Dasarahalli zones could not be analysed. For the West zone, the tabular compilation was unavailable from 2013-2019. For R R Nagar, only files after 2019 were uploaded and for Dasarahalli, a substantial share of data is available only in Kannada.
To illustrate, in the West zone (ADTP) data corresponding to 855 sanctions ( 22% of the total data in the West zone) is uploaded as a combined PDF of individual plan sanction documents for a particular year (only in Kannada) with no specifications for the plans available in compiled format.
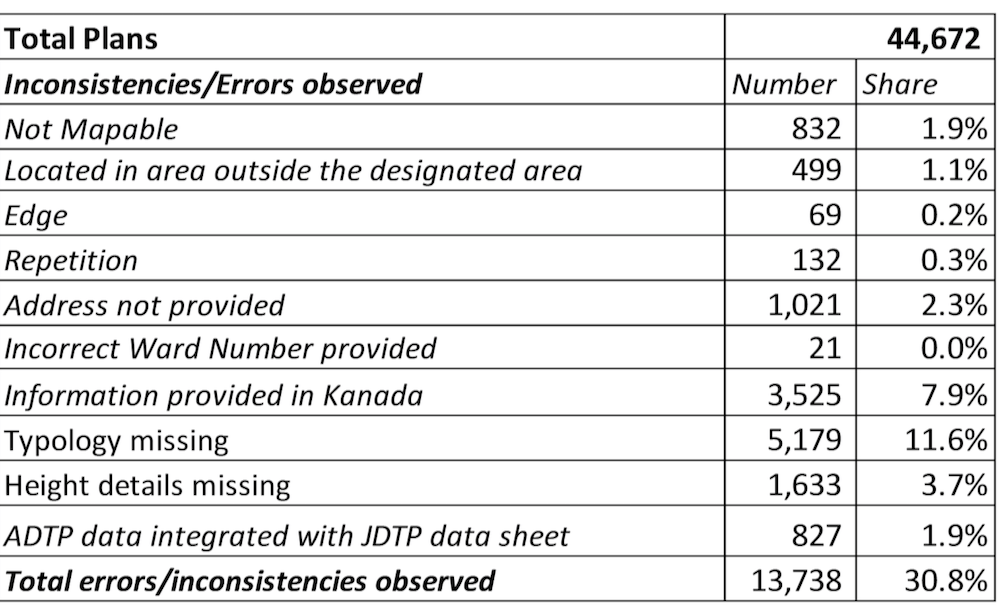
Overall, we accessed data on 44,672 plan sanctions across all categories and zones. Approximately, 31% of the data was lost due to various errors.
Read more: Real estate developers face few hurdles in getting environment clearance
Challenges to collating and analysing data:
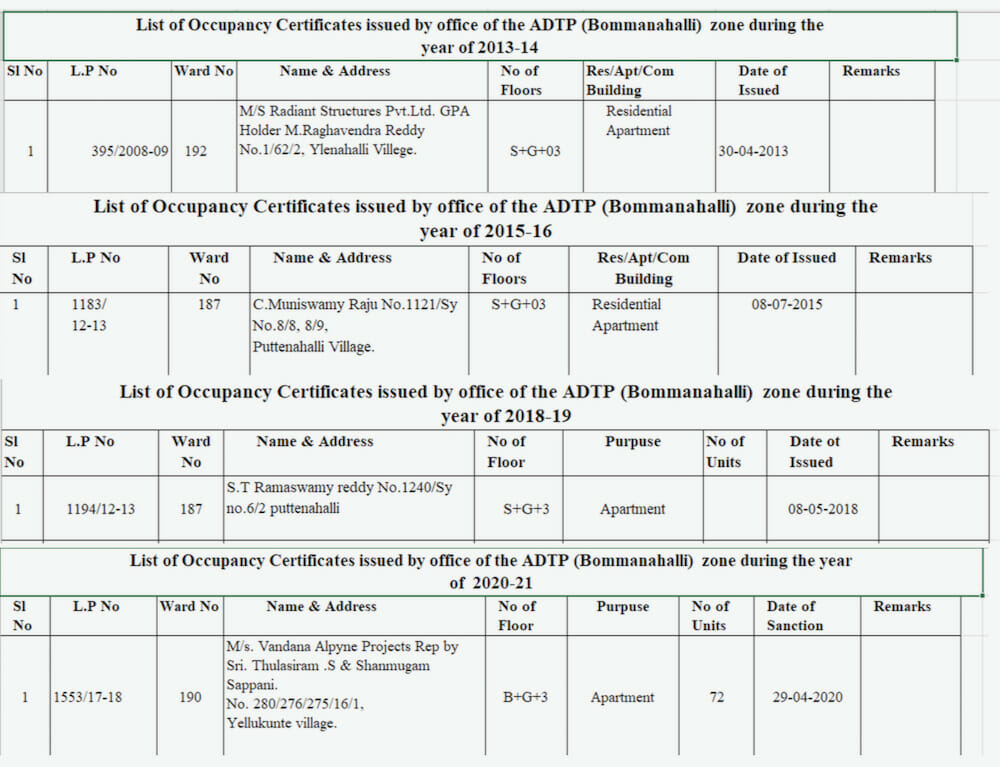
Lack of consistency in recording data was found to be a major challenge when collating and analysing the data. For instance, what was categorised as ‘residential’ in one year was shown as a ‘residential building’ or ‘apartment’ in the next year.
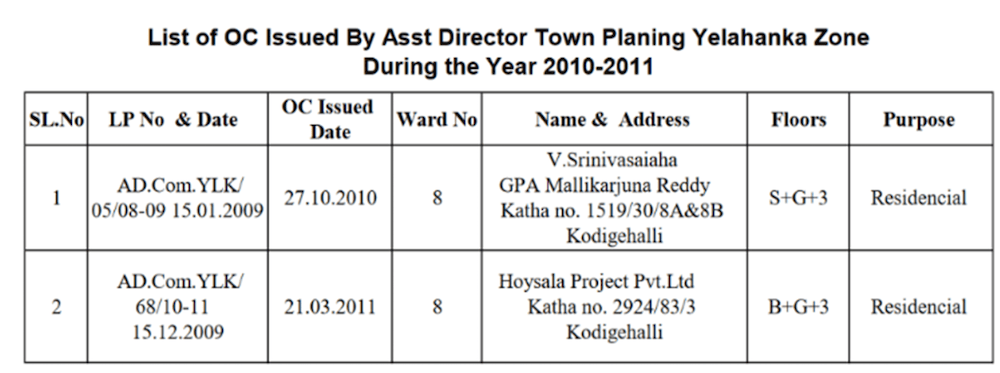
Similarly, there is little or no consistency in the addresses that were captured. For instance, while ward numbers are mentioned in some zones across a few years, in others, the address is limited to Khatta or Survey numbers.
Further, while the data is captured temporally, there is inconsistency in formats – some data is available as excel sheets, while others are put out in PDF formats or as Microsoft word documents. Yet others are uploaded as a table on the webpage. These varied formats required normalising the data formats. Simple spelling errors coupled with some data-sheets having a column for remarks which was absent in others rendered the data cleaning and collation task tedious.
Eventually, data collation became a manual exercise of patient cleaning and categorization of the data. What these errors highlight, at the minimum, is the absence of a uniform reporting format or a template to guide the data entrant. Additionally, the poor skill sets of the data entrant perhaps contribute to the errors.
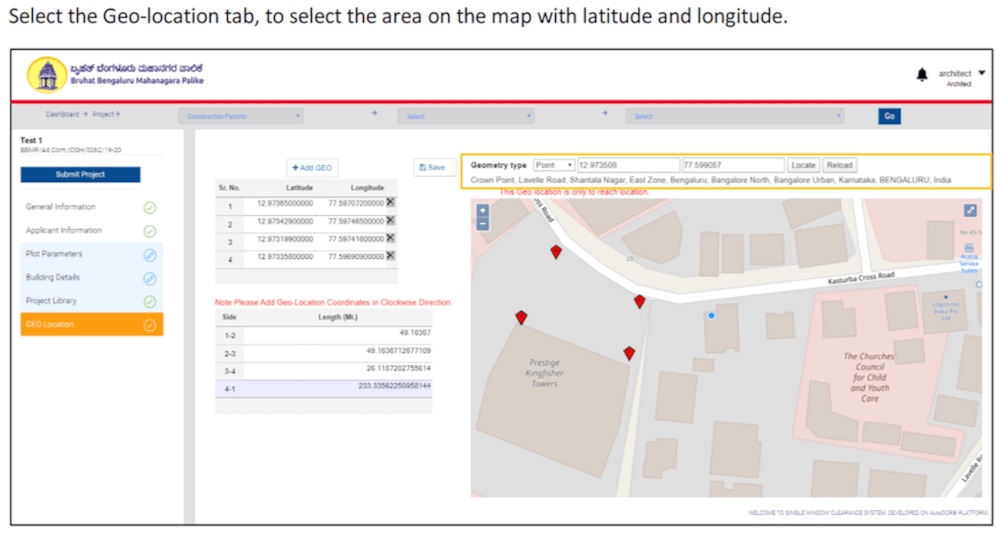
The second challenge is the lack of spatial representation of the data collected. While the building plan application manual mandates the data on the geo-location coordinates, this data-set is not available publicly.
Relying on the addresses captured, we aimed to spatialise the data. For this, we used Google Earth and Google Maps. However, alternate locations for a query on any one address was the norm. These had to be confirmed manually from the multiple alternatives suggested by Google Earth.
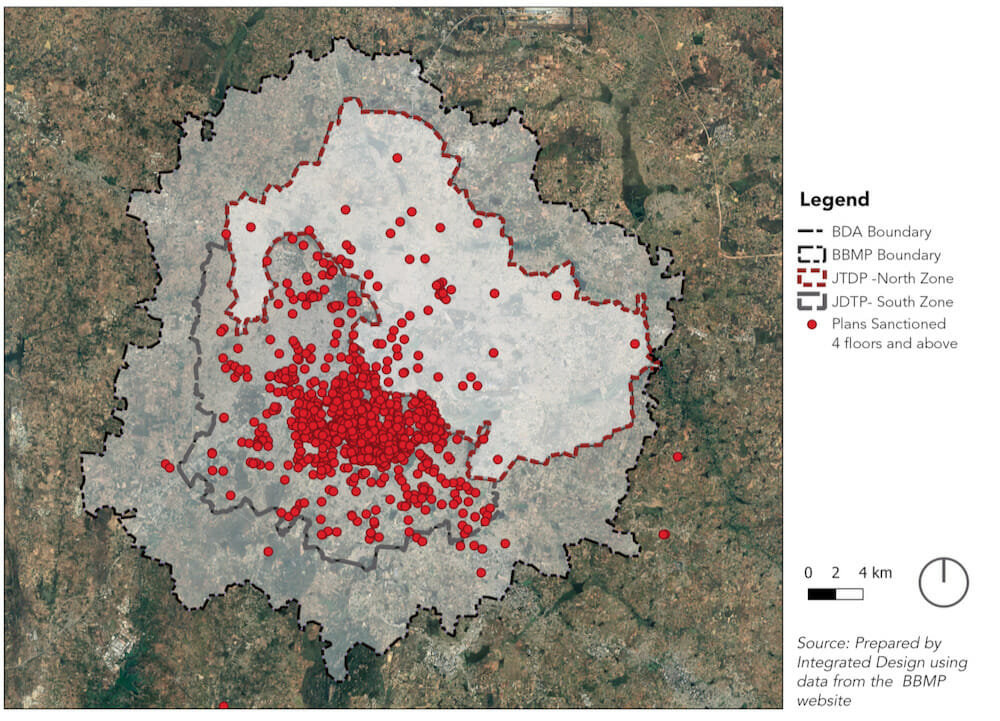
We geo-located the addresses manually for 1,015 data points for building plans sanctioned with four and above floors in the South Zone (JTDP). Approximately 5-7% of the total points could not be located owing to incomplete address descriptions. Thus, a loss of crucial data.
This exercise of geo-locating the data revealed yet another error – a wrong categorisation of data vis-à-vis the jurisdictional boundaries. For instance, plans sanctioned by the ADTP were found in the JDTP data sets. Similarly, sanctioned plans in the Yelahanka and Mahadevapura areas, which are a part of JDTP North zone, were uploaded as JDTP South. The data sets also revealed several locations outside the BBMP and even the BDA boundary. This could be attributed to the ambiguity in the address details.
The Bommanahalli zone was an exception. Data is uploaded meticulously in a consistent and standard format, thus making the collation simpler and easier to process.
In conclusion, the application seeking the building plan sanction generates data along defined parameters. Yet, what is available in the public domain is limited and of a woeful quality, leading to serious doubts on the accuracy of the uploaded data as well as data that may be missing while collating. The publicly available data can be used in myriad ways to understand the city and take informed decisions on its growth, data quality check is an emerging imperative.