On September 24th, Prof. Ashish Verma, Convenor, IISc Sustainable Transportation Lab (IST Lab) released a voluminous 479-page report co-authored with Hemanthini Allirani from IST Lab, recording air quality index and several other indicators of Quality of Life (QoL) due to ‘pedestrianising urban streets’ – essentially closing roads to traffic.
This is a part of the Innovating for Clean Air (IfCA) programme, a joint initiative between India and UK to pilot air quality improvement initiatives in Bengaluru. Being the first such initiative in Karnataka, the initiative is named ‘Church Street First’, based on the location of the study.
Church Street was closed to vehicular traffic on an experimental basis every Saturday and Sunday from 10 am to midnight for four months, from November 7th, 2020 till February 28th, 2021. The study was done during this period. Church Street is currently open to vehicular traffic. The study involved extensive data collection and field studies by DULT (Directorate of Urban Land Transport).
Read more : Make Commercial St, Malleswaram 8th Cross, Gandhi Bazaar pedestrian-only, demand civic groups
The quantitative indicators:
The parameters were :
- Air quality
- Pedestrians – level of service
- Boarding and alighting at public transport stations
- Street cleanliness and maintenance
The qualitative indicators:
- Sentiment analysis on social media comments and captions (in particular, on Instagram)
- Visitor’s opinion on pedestrianised streets and its impact on Quality of Life, measuring their motivation and satisfaction in terms of push and pull factors, and their revisit and advocacy intentions.
- Opinion of shop owners of Church Street on pedestrianisation of the street for comprehensive evaluation in terms of Quality of Life.
Key findings:
Quantitative indicators:
- Clear improvement in air quality
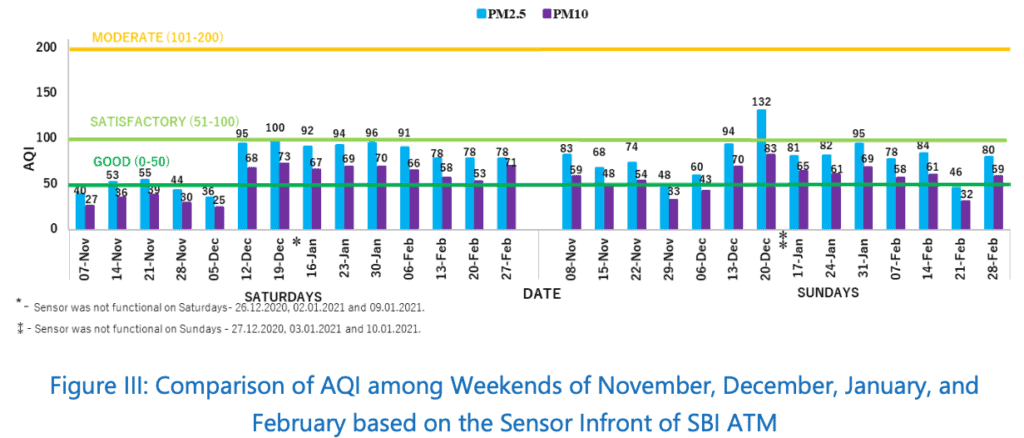
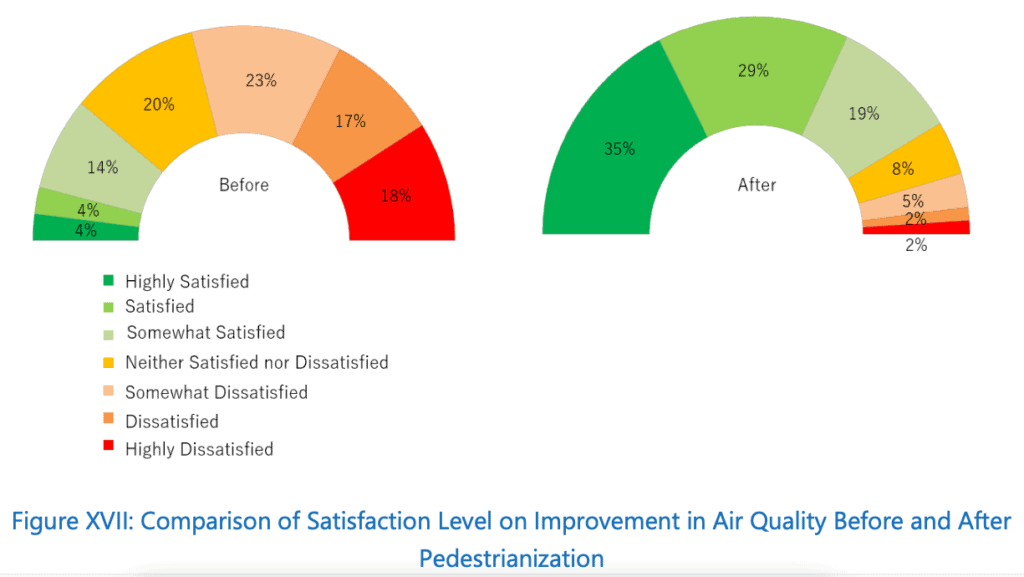
A clear improvement in air quality, in terms of PM10 and PM2.5 concentrations, was recorded during most of the pedestrianised weekends as per the Air Quality Index (AQI) CPCB formula. These concentrations were found to be within the limits set by CPCB under the National Ambient Air Quality Standards.
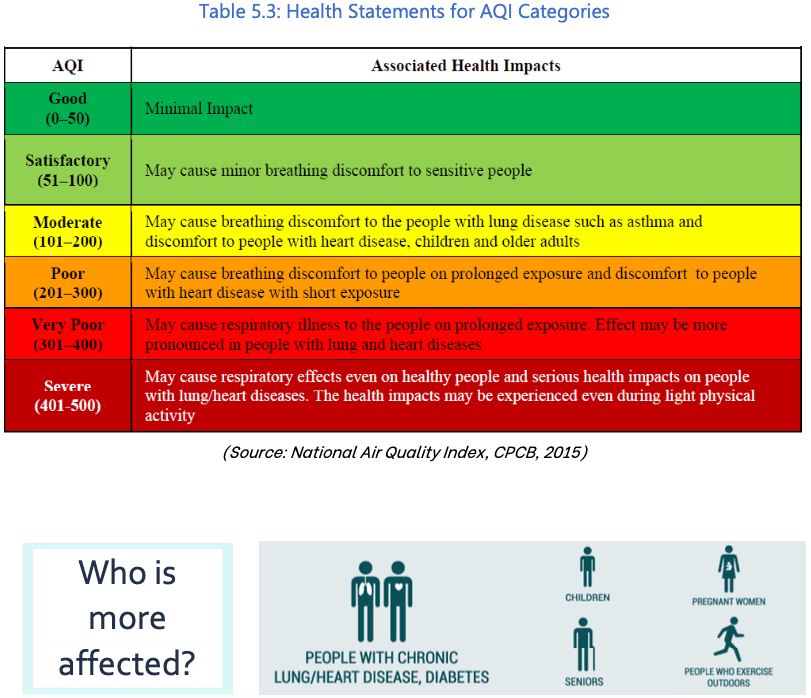
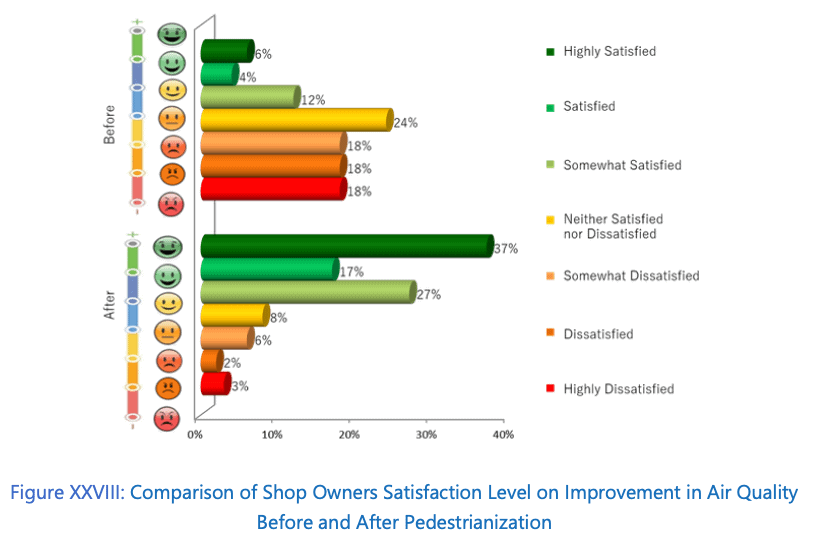
Also, the survey responses showed that 83% of visitors and 81% of shop owners were satisfied with the improvement in air quality after pedestrianisation.
In Church Street, ambient PM levels were monitored daily using three Fixed Air Quality Monitoring Sensors (FAQMs) placed at three locations. The data recorded include PM10 and PM2.5 concentrations, as well as meteorological data (temperature, humidity, and pressure).
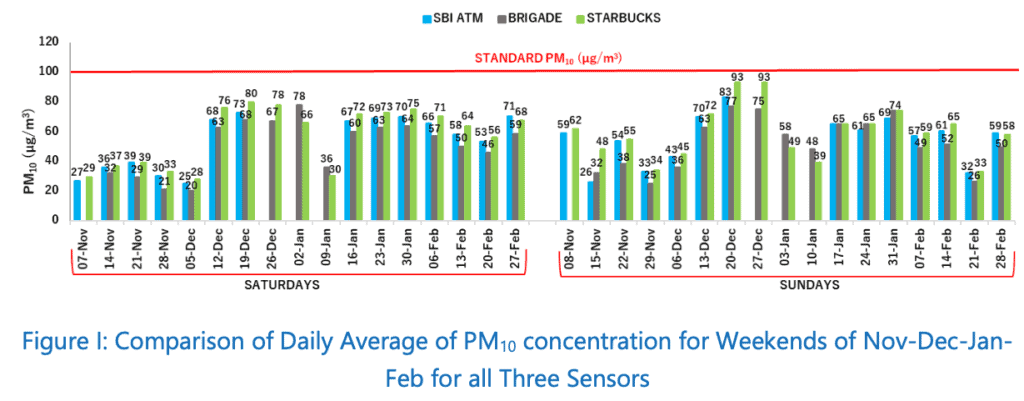
The averages were observed to be higher near Starbucks Coffee and lower near Brigade Garden. When weekends from November to February were considered, many Sundays had a higher average concentration than Saturdays except during a few weeks in January and February. This variation could have been due to the difference in wind speed, temperature, change in traffic on the nearby roads, and the difference in the number of cleaning and other activities between Saturdays and Sundays.
In Bengaluru, December is observed to be the coldest month. The sudden increase in average daily PM10 concentration in December could have been due to the excavation activities near Brigade Road. However, a decreasing trend in average daily PM10 concentration was observed on weekends during February.
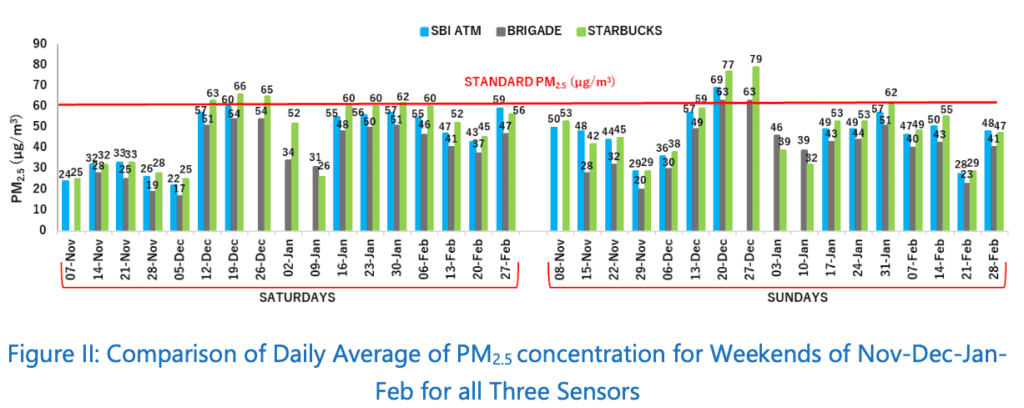
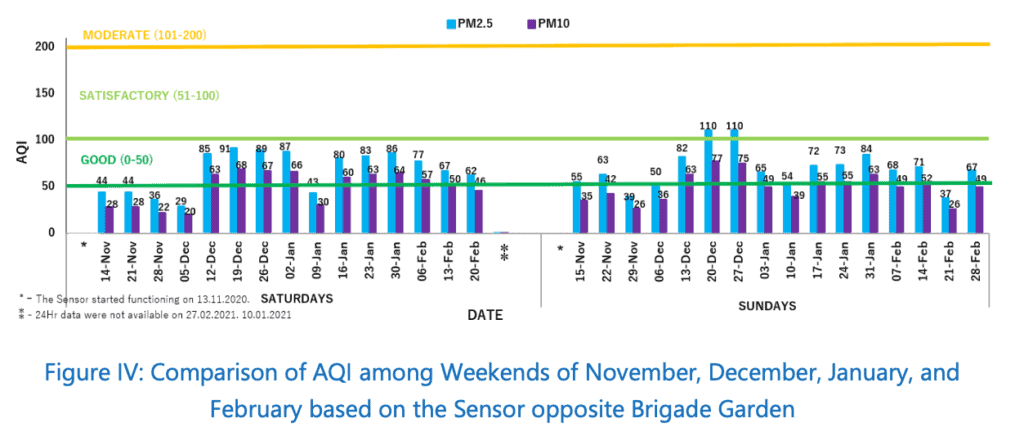
The Brigade Garden sensor, located in the street’s mid block section, had the lowest concentration of PM2.5 as compared to the other two sensors. Because of pedestrianisation on weekends, vehicle-related emissions of PM10 and PM2.5 in the stretch did come down. Among all the months, the lowest PM concentration was observed in November and the highest in December. It was found that the lowest concentration during the day was from afternoon till late evening hours. And the highest concentration during late night to early morning, due to temperature inversion effect. (Also called thermal inversion, this means a reversal of the normal behaviour of temperature in which a layer of cool air at the surface is overlain by a layer of warmer air. Under normal conditions air temperature usually decreases with height.)
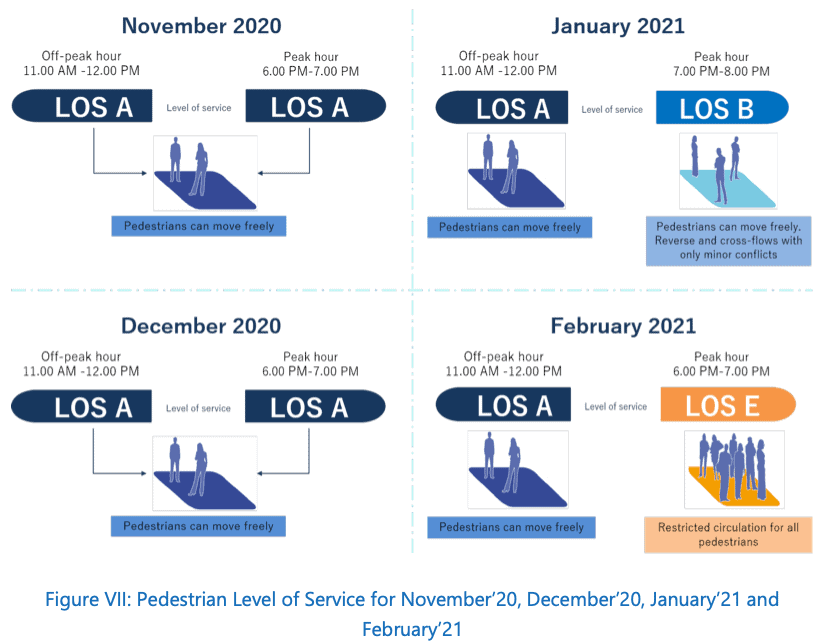
2. Analysis of Pedestrian Level of Service
As for pedestrian footfalls, the average daily footfall on Church Street increased by 92% and the average peak duration footfall increased by 117%. The survey on pedestrian level of service during peak and off-peak hours based on the Highway Capacity Manual of India for urban road guidelines showed that 97% visitors and 84% shop owners were satisfied with overall service quality after pedestrianisation.
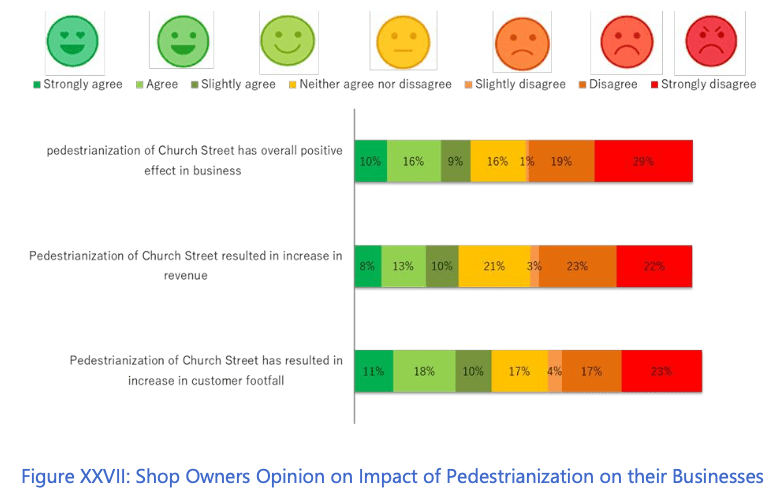
Further, more than 50% of restaurant owners and gift shop owners on Church Street agreed that pedestrianisation led to an increase in customer footfall, revenue, and had an overall positive effect on business. However, this agreement level was comparatively lower for other types of businesses leaving some scope for future improvements and strategies.
Pedestrian volume was extracted manually on an hourly basis between 10.15 and 10 pm on weekends based on videographic data. Pedestrian count is a quantitative measure of the number of pedestrians using a particular facility. The pedestrian flow parameters, i.e., speed and density, are extracted using IISc PED SENSE software:
Total number of visitors/pedestrians in Church Street during weekends:
November = total 72,209, peak – 1000/hour
December = total 82,215, peak – 2000/hour
January = total 1,34,706, peak – 3000/hour
February = total 1,35,540 peak – 6000/hour (on February 14th between 7 pm and 8 pm)
Highest pedestrian footfall was observed from 5 pm to 9 pm.
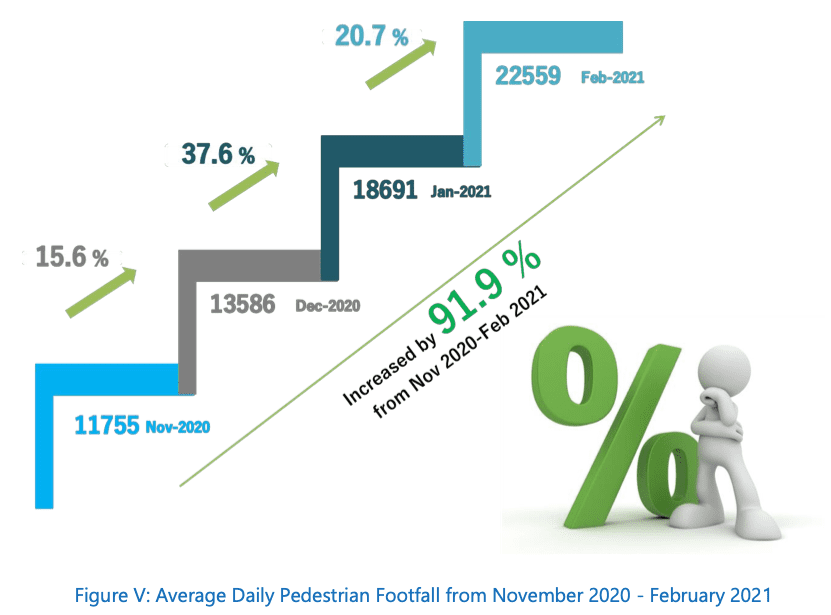
Figure V infers the pedestrian count from 10.15 pm to 10 pm was more than 11,000 for weekends and was found to increase gradually every month.
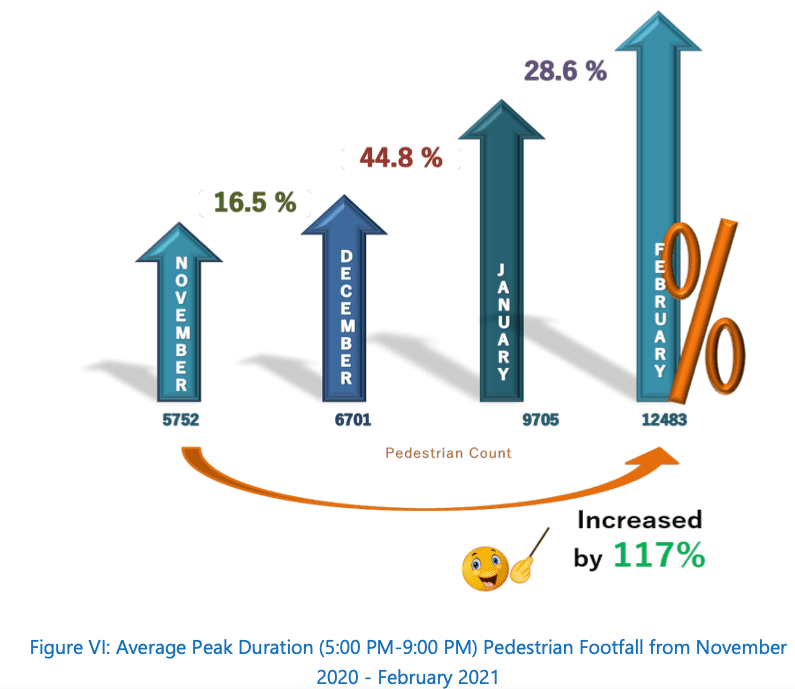
Figure VI infers that nearly 50% of total pedestrians visited Church Street during the peak duration 5 pm to 9 pm on weekends.
The average speed of pedestrians during off-peak hours was found decreasing from November 2020 to January 2021, while a slight increase in speed is observed for February 2021. In contrast, the average speed of pedestrians during peak hours was decreasing consistently from November 2020 to February 2021 (decreased by 57.9%).
The main reason for the reduction in walking speed is the increase in pedestrian footfall during the evening hours. The average pedestrian density increased only slightly during off-peak hours, while a considerable increase in density is observed for peak hours from November 2020 to February 2021. During peak hours, the flow rate of pedestrians increased 8.7 times from November 2020 to February 2021.
Read more : Bengaluru’s climate no longer cool. Here’s why
3. Boarding and Alighting at Public Transit Stations
The demand impact of public transport was observed at the public transit stations, at Mahatma Gandhi (MG) road Metro station and four bus stops: Chinnaswamy Stadium, Bowring Institute, Mayo Hall, and Brigade Road bus stop.
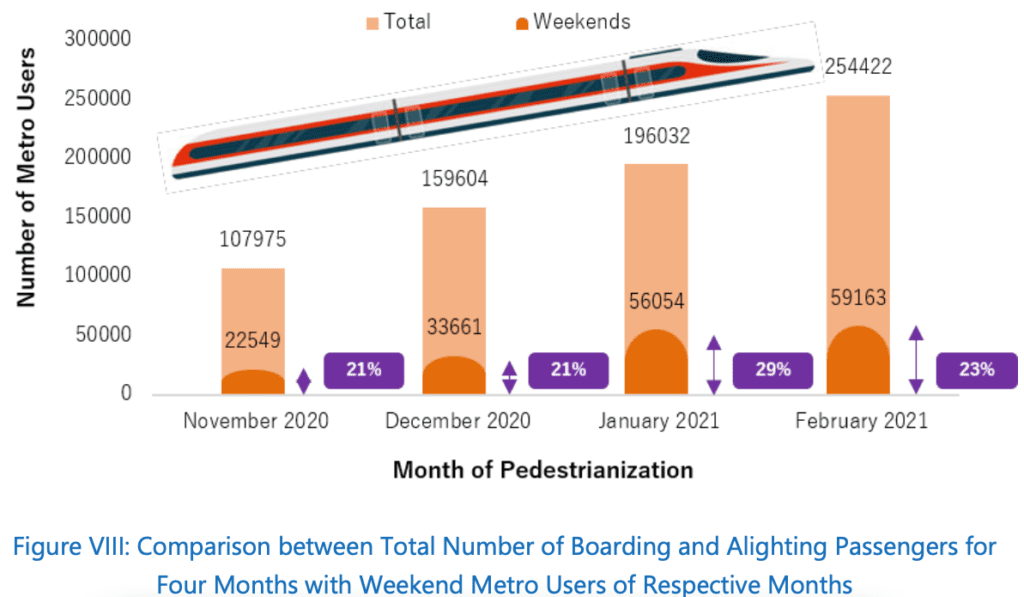
The metro station is situated in the Central Business District (CBD), and hence during morning hours, passengers’ alighting from the station towards the CBD is higher, and the inverse during evening hours. The number of alighting passengers is more from 5 pm to 8 pm on most days. The pedestrian footfall at Church Street is also high during this time period.
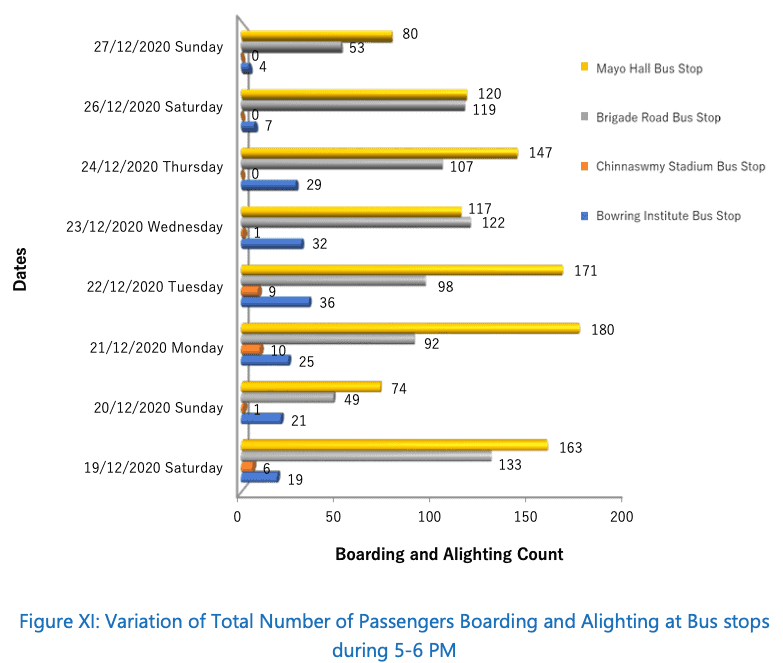
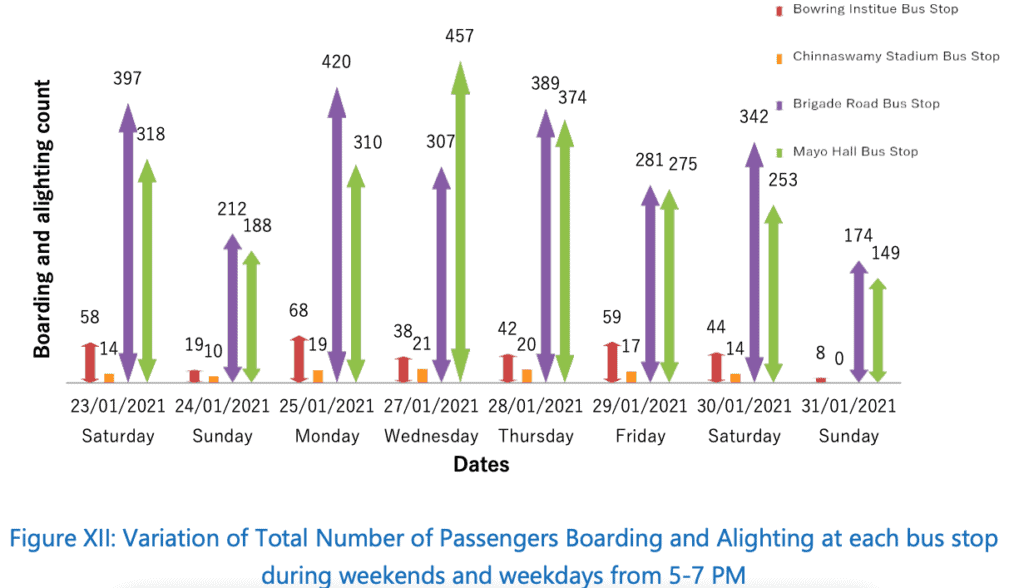
The boarding and alighting survey was not conducted on January 26th due to a bus strike and the “Go farmer rally”. It is inferred that the number of boarding is more than alighting. Brigade Road and Mayo Hall bus stops have comparatively more boarding and alighting. Some visitors to Church Street are not aware of the bus stops. Hence, sign boards showing the direction to the nearest bus stop can be provided on the pedestrianised street in future implementation.
3. Street Maintenance:
The two main street cleaning activities carried out in Church Street by BBMP workers are frequent garbage collection and sweeping the street to maintain cleanliness.
- During all weekdays, on average, garbage is collected four times a day.
- During all weekdays, on average, sweeping is carried out two times a day.
- On weekends, both garbage collection and sweeping are carried out 8 to 10 times a day
Qualitative Studies
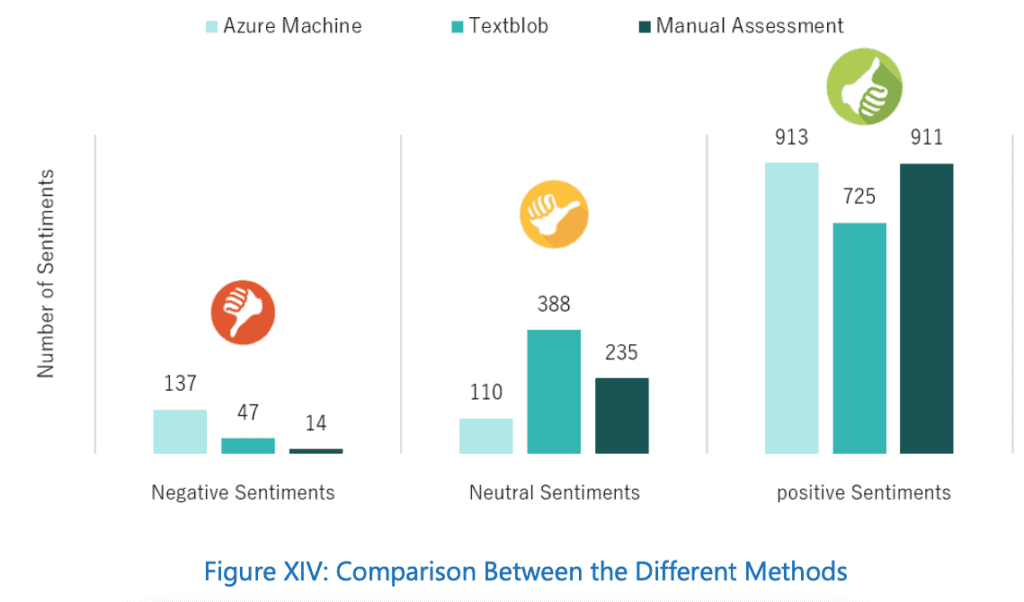
- Sentiment Analysis on Social Media Comments and Captions: The analysis of comments and captions on Instagram were equally heartening. The analysis showed at least 78% of social media statements on this initiative were positive, clearly indicating how much people were able to relate the pedestrianisation initiative with Quality of Life.
2. Visitors’ opinions on Quality of Life and Pedestrianised Street: From 656 respondents
- 94 were first-time visitors.
- 52% were male and 48% female
- The most significant proportion of the sample collected is in the younger age group, i.e., 18-29 years (37% male & 35% female) followed by 30-44 years (8% male & 6% female) and 45-60 years (4% male & 4% female).
- 28%, 26%, and 22% of visitors to Church Street come for dining, recreation, and shopping respectively
- 14% of the visitors come for walking, 6% for work, and 4% for business and other purposes
- For 90%, the visit to Church street was for recreation and leisure, and only 10% for work
- 71% of the visitors spent more hours in Church Street than they usually did
- 91% of the respondents agreed that pedestrianisation was the reason to spend more time in the street
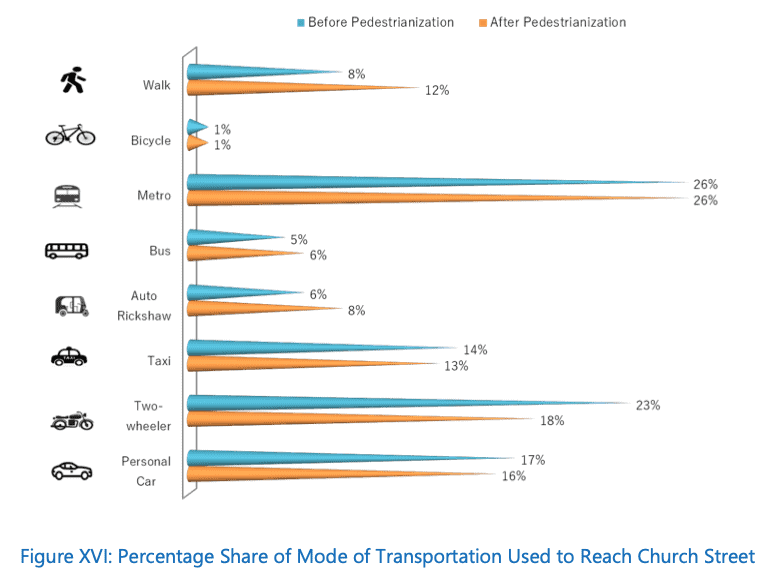
Modes of transport –
Visitors: Private vehicles: overall 7% decrease
Public transport: 7% increase
Shop owners: Private vehicles: overall 15% decrease
Public transport: 11% increase
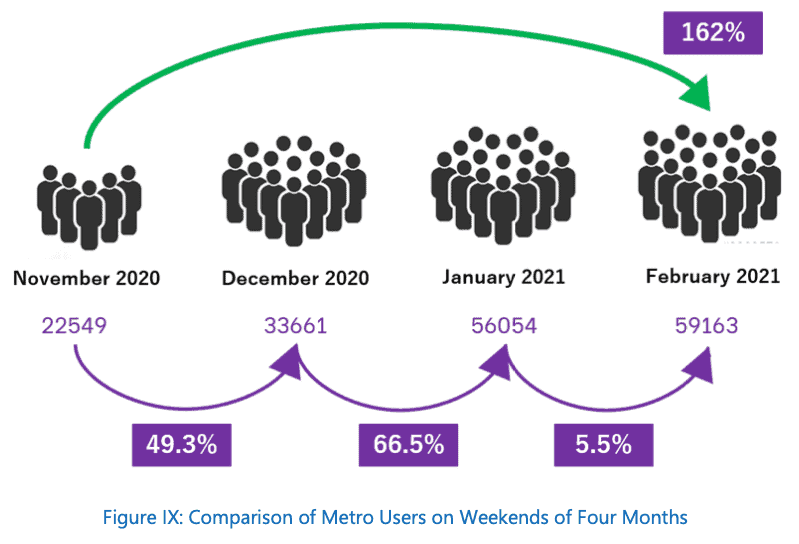
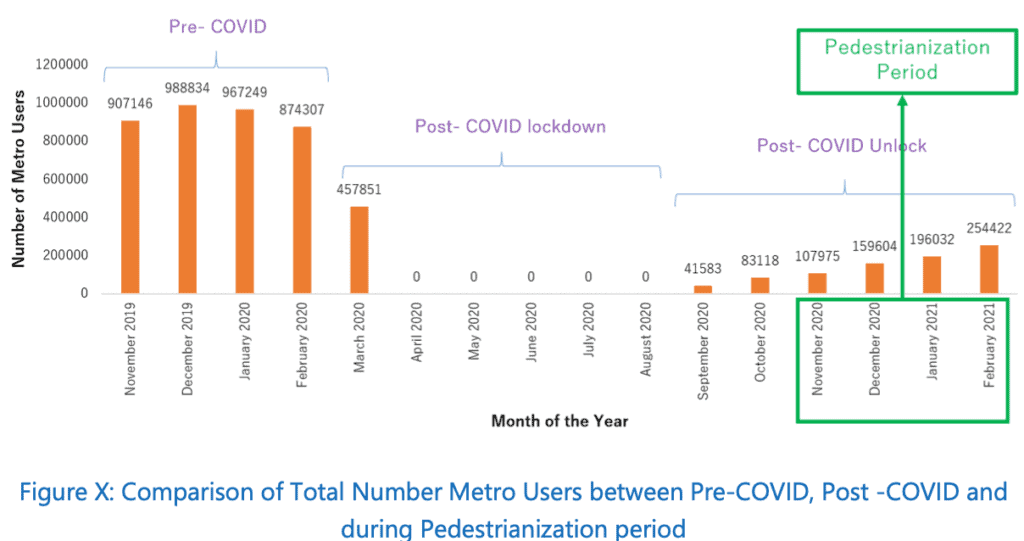
Metro: 162% increase in metro ridership
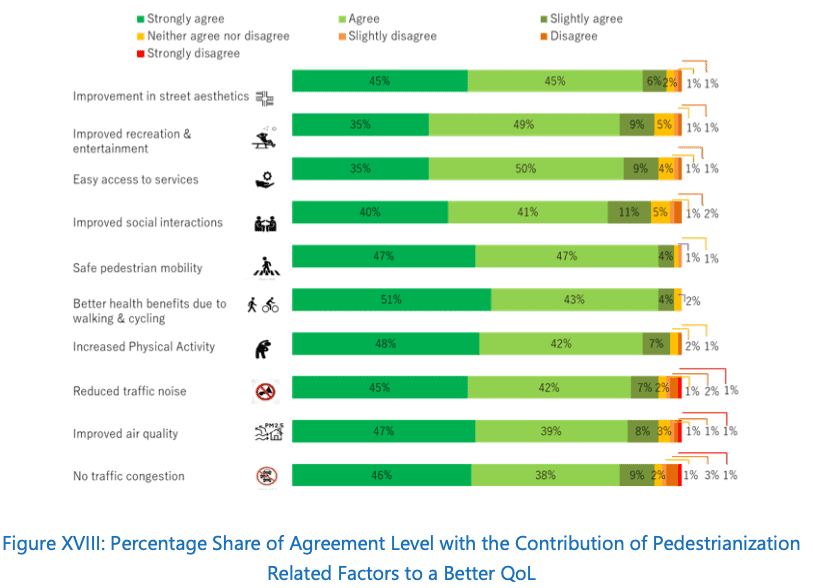
The impact assessment identified 10 factors related to the pedestrian-only environment to understand visitors’ perception of these factors’ contribution to a better Quality of Life.
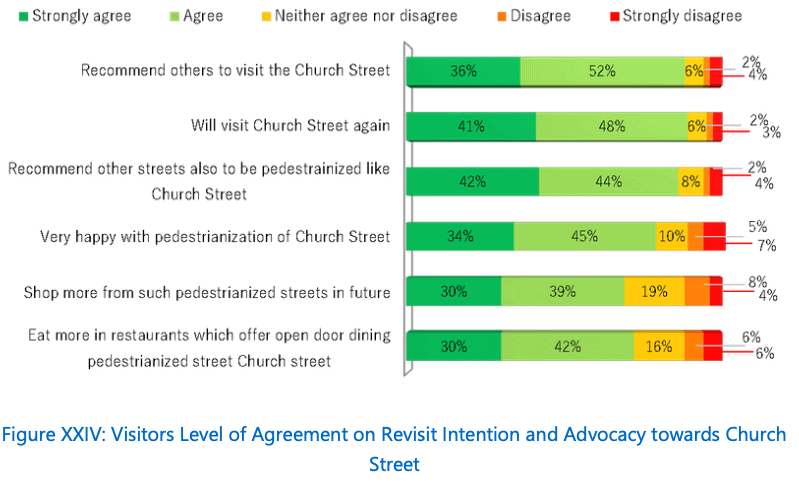
3. Measuring Motivation and Satisfaction Level of Visitors: Push and Pull factors
Push factors are related to visitors’ internal socio-psychological influence, while pull motivations are external or situational aspects that motivate them to visit pedestrianised street. The dominant pull factors were: to spend quality time with their friends and family, enjoy the free walking environment on pedestrian-only streets, and a sense of fulfilment of contributing to the clean air initiative. The dominant push factors were availability of a wide variety of entertainment activities, outdoor dining experience, safety and security on a vehicle-free street.
Further, the high level of agreement among visitors on revisit and advocacy intentions shows the successful acceptance of such pedestrianised streets.
4. Shop Owners’ Opinion on Pedestrianised Streets:
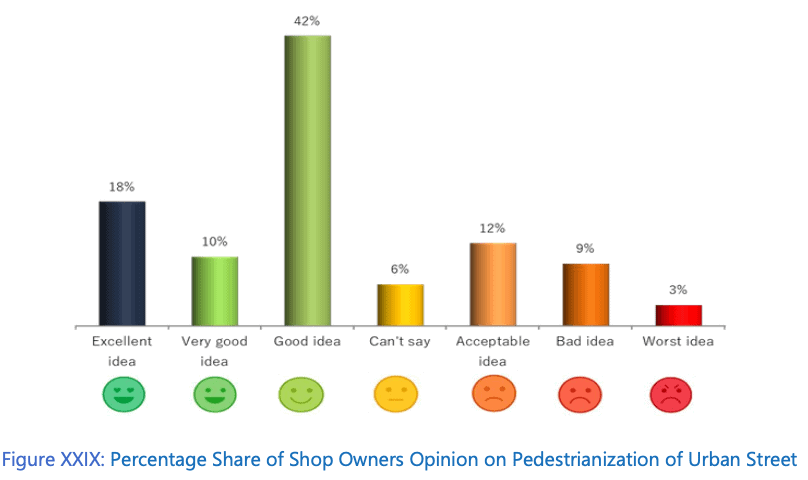
Assessing the impact of pedestrianisation on Quality of Life
Extensive dependence on motorised vehicles resulted in externalities including traffic congestion, road accidents, difficulties for active transport (walking and bicycling), air pollution, and noise pollution, thus deteriorating one’s Quality of Life (QoL) and liveability of the city (Ahmed and Monem, 2020). The transport sector is identified as a major sources of air pollution that adversely impacts citizens’ health (Verma et. al., 2020). Consequently, the benefits of pedestrianisation could be assessed based on environmental, social, and economic aspects, the three pillars of sustainability.
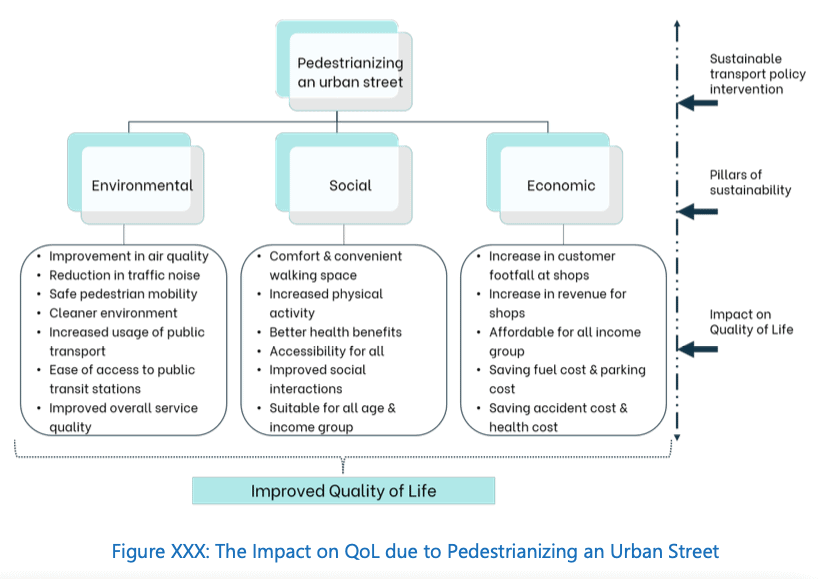
Environmental: The average daily PM10 concentration for all the weekends of all months studied is within the CPCB limit of 100 μg/m3. The daily average PM2.5 concentration was within the CPCB limit of 60 μg/m3 for all weekends of November and February. In terms of noise levels, 94% of visitors interviewed agreed that traffic noise had reduced and air quality had improved due to road closure for traffic contributing to a better QoL.
Social: On health issues, 98% of visitors agreed that walking and cycling because of pedestrianisation was an important health benefit. Also, 92% respondents agreed that improved social interaction contributes to a better QoL, while 94% agreed that access to services was easier pedestrianising urban streets increases the comfort and convenience of road users. The street is also accessible for all age groups, and provides a platform for social interaction thereby enhancing social well-being.
Economic: Assessing shop owners’ opinion on impact of pedestrianisation on their businesses showed that 35% of shop owners agreed that pedestrianisation of Church Street resulted in an overall positive effect on their business.
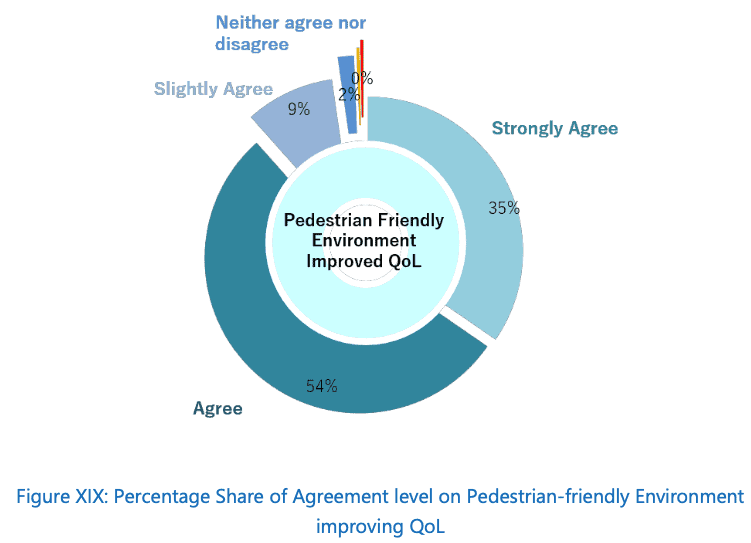
Overall, there was 98% agreement that a pedestrian friendly environment improved Quality of Life, with key contributory factors being easy access to services, improved social interactions, better health benefits due to walking and cycling, increased physical activity, access for all age groups, and safe pedestrian mobility.
Data Sources: Ambee fixed air quality sensors; CCTV camera data from traffic police, GoPro cameras; boarding and alighting data of MG Road Metro station from BMRCL; manually collected boarding and alighting data of the four nearest bus stops namely, Mayo Hall, Brigade Road, Chinnaswamy stadium, and Bowring Institute; Street maintenance activities data from BBMP; 656 samples of visitor’s opinion survey; 518 samples of visitor’s motivation and satisfaction survey; and 115 samples of shop owner’s opinion survey.
Excellent & comprehensive study. Heartening to know that shopkeepers too find pedestrianisation beneficial. Needs to be extended to other parts of city too. Poor bus connectivity the spoiler, overall
Hopefully BBMP will add few more streets in this category in near future