In the last few months, Bengaluru has seen rapid changes in its COVID tally. What’s the current situation in the city? Are cases likely to reduce? Are death rates really reducing?
Following are some key takeaways based on an analysis of data from the last few months.
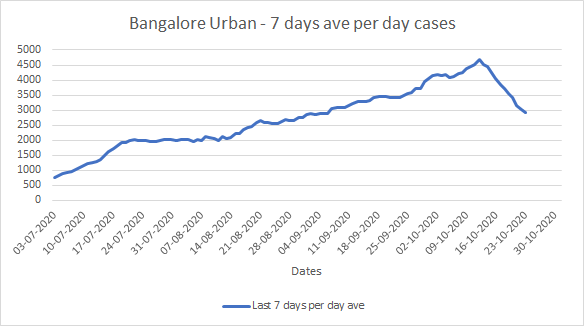
Number of positive cases per day has been decreasing
Bengaluru seems to have hit the highest per-day cases on October 8, with 5121 cases. Since then, per-day case count has been on a decreasing trend.
Considering previous seven days’ average data, we reached the peak on October 12 and cases have been reducing since then.
The positivity rate (percentage of COVID tests that turn positive) in Bengaluru has sharply declined too. As per BBMP’s October 21 report, the positivity rate for October 1 to 20 was 10.21%, much lower than the rate of 12.79% in September. Whereas the positivity rate was 13.45% in August, and 24.15% in July!
Testing has been increasing steadily
Testing has been going up since early October. Since October 7, RT-PCR tests have stayed above 50,000 per day, and above 70,000 per day since October 14. (Rapid Antigen Tests have not been considered here because of their likelihood of showing false negatives.)
Going by Chennai’s COVID curve, if testing stays up, we might end up plateauing between 1000 and 2000 cases, until a second wave happens or we get a vaccine. But testing has to stay up. One other worry is the festival season. Lower numbers might prompt people to throw to the wind whatever little caution they had. This is where testing numbers will be the final barrier.
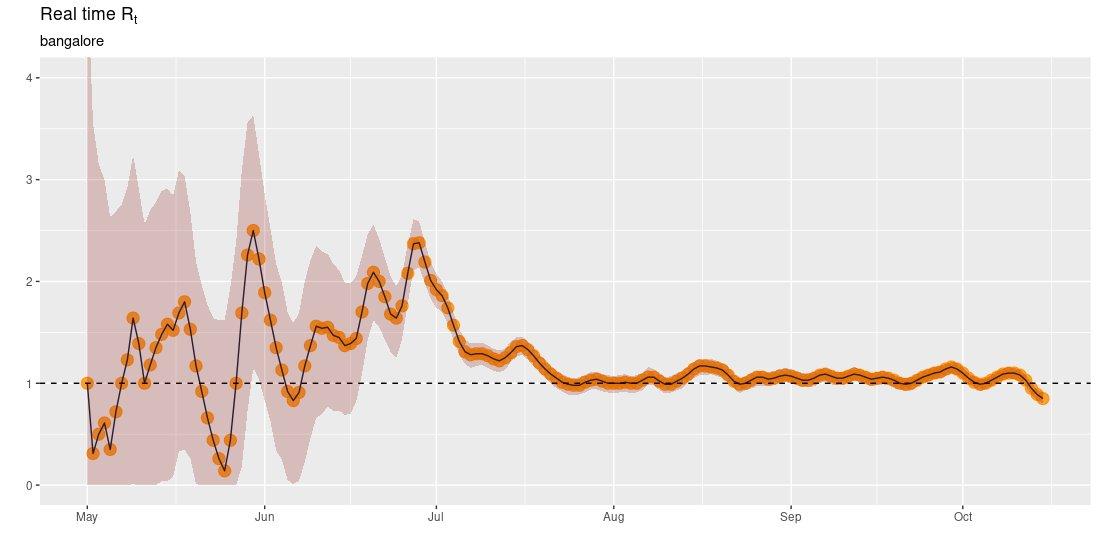
COVID patients are infecting fewer contacts
We probably also have hit a R[t] under 1.0. R[t] is the average number of people one infected person infects. So a value of 1.1 means, every 10 people cause 11 others to get infected. If we are under 1.0, it means every 10 people are infecting less than 10 others, which means the number of cases will decrease over time.
Active cases might drop soon
What I’ve observed is that active cases tend to be around 14 times the daily average. It could be because most of those who get infected usually get cured in two weeks. Currently Bengaluru has around 56,000 active cases.
But the number of patients getting discharged is exceeding the number of new positive cases every day. Hence the number of active cases may drop down into the 50,000s and then 40,000s in the next 1-2 weeks.
Is Bengaluru’s fatality rate really dropping?
This is where things get very heated up.
Karnataka:
The death rates seem to have reduced over time. Earlier, detailed demographic data of the victims used to be uploaded. As of August 28, this is what the data showed about mortality rate for different age groups:
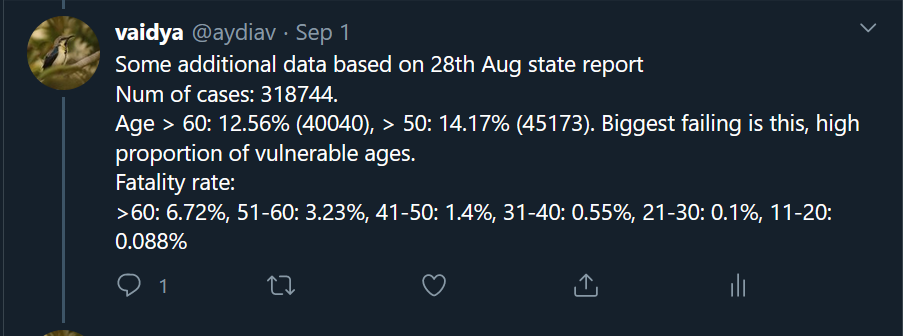
The fatality rate varied from 6.72% for those aged above 60 years, to 0.08% for those aged 11-20 years. The total fatality rate as on August 28 was 1.68%.
Age-wise fatality rate was uploaded last on September 3, when the total number of cases was 3.6 lakh.
| Age group | >60 | 51-60 | 41-50 | 31-40 | 21-30 | <=20 |
| Percentage of total cases | 12.7% | 14.15% | 17.55% | 21.89% | 22.5% | 11.1% |
| Fatality rate | 6.63% | 3.14% | 1.38% | 0.52% | 0.17% | 0.14% |
| Deaths | 3046 | 1255 | 879 | 417 | 141 | 42 |
Total fatality rate as of that date was 1.64%. In terms of the percentage of positive cases among different age groups, it’s likely that many youth don’t get tested as their immune systems are more robust, and hence they may not get counted.
As per September 15 data, it reduced again to 1.57%. And as of October 17, the total number of cases was 7,58,574 and total deaths was 10,427. This gives a total fatality rate of 1.37%.
However, there have been two strikes by health workers during September, which could have reduced the reporting of deaths.
Bengaluru:
Fatality rate has reduced steeply
Bengaluru’s CFR (Case Fatality Rate) is now at 1.16%. Here too it’s not clear if a low CFR has been genuinely achieved or if deaths are not being counted on time.
Though the data on deaths seem more up-to-date now, in earlier reports deaths from even over a month ago would be recorded. For example, if you see the State report of September 15, of the 41 deaths reported in Bengaluru Urban district, several were those that occurred between August 25 and 31.
Or take the report of September 29, in which 67 deaths were reported from Bengaluru Urban. Of these, 33 deaths had happened in August. The next day’s report said that Bengaluru’s CFR was 1.28%.
But this has changed. For example, in the report of October 21, of the 53 deaths, 48 had happened between October 18 and 20. The oldest case was from October 11, and there were only a few from October 14 and 15.
So, while the CFR has dipped from 1.28% in September end to 1.16% now, this could also be because all deaths are not being reported on time. If the backlog is not being counted properly and several deaths get reported only towards end of the month (as happened in September), the CFR may shoot up again in October end.
Fatality rate Vs Number of positive cases
The following graph is interesting from the fatality rate perspective:
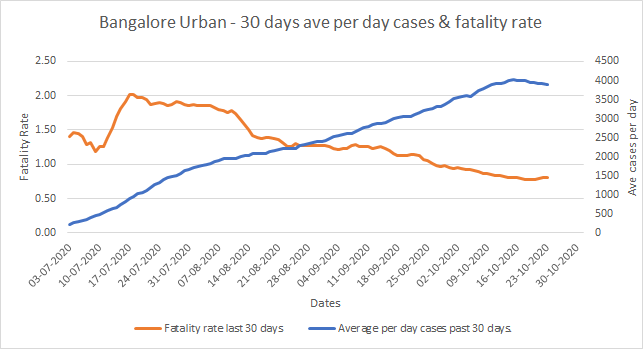
The blue line shows the 30-day average of positive cases, and the red line shows the 30-day average of fatality rates. (Fatality rate for any date is calculated by dividing the number of deaths over the previous 30 days by the total cases over those 30 days.)
Note how the fatality rate was plummeting even as the daily average cases were climbing up, till a few days ago. Initially the fatality rate climbed because they were counting more deaths but not many positive cases. And then you expect it to come down to a low value and stay there.
Well, it did reduce and stay a stable value till September 15. Around 1.2-1.3% was the fatality rate then. And then it starts dropping again. As of yesterday, it was around 0.81% while Bengaluru Urban’s fatality rate was way higher at 1.25-1.3% as of early September.
Now, is it that they’ve ramped up their facilities over the last one and half months to the point of reducing fatalities to this extent? Or are there other possibilities – perhaps younger people are getting infected in higher numbers and hence the fatalities are lower OR are we undercounting the deaths?
Major decline in age-wise fatality rate
Let’s look at the age-wise split as per the BBMP bulletin of October 21.
| Age split | >70 | 60-69 | 50-59 | 40-49 | 30-39 | 20-29 | <20 |
| Percentage of total cases | 5.71% | 9.16% | 14.03% | 18.12% | 23.58% | 21.00% | 8.39% |
| Total cases | 18018 | 28905 | 44273 | 57179 | 74409 | 66267 | 26475 |
| Percentage of total deaths | 29.6% | 27.02% | 23.22% | 12.21% | 5.27% | 2.04% | 0.65% |
| Total deaths (3632) | 1075 | 981 | 843 | 443 | 191 | 74 | 23 |
| Age wise CFR as of Oct 21 | 5.96% | 3.39% | 1.9% | 0.77% | 0.25% | 0.11% | 0.08% |
| Age wise CFR as on Aug 31 | 6.95% | 5.25% | 3% | 1.4%* | 0.55%* | 0.1%* | 0.088%* |
The difference in fatality rate by age group seems in line with what we saw before. However, the point to note here is that the CFR of those between 60 and 69 years has dropped to 3.39% from 5%, and for 50-59 age group it has declined to 1.9% from 3%. Most fatality rates across demographics seem to have dropped by around 33-35% since the end of August.
A drop in fatality rate by one-third across most age groups is definitely welcome. However, we need to be sure that this data is real and that deaths are not being undercounted.
What would really give us a clear picture is comparing the number of deaths (cremations + burial data) of BBMP between the similar periods in 2019 and 2020. That data, I believe, is not online and can be obtained only through RTIs.
ICU numbers dropped and increased again
Another point to note is the ICU admission data. Even as the cases were climbing, the number of people in the ICU was coming down. But now the ICU numbers have risen again.
For example, on September 15, the number of those in ICU in Bengaluru Urban was 263. Total positives at that time was 1,76,712, and total active cases were 41,000.
As of October 1, the number of cases was 2,37,516, and active cases were 52,500, but ICU numbers was only 268, hardly an increase from September 15. But now, the number of cases in ICU has gone to a high of 431, and active cases are at 56,000 odd!
To summarise, the number of tests have been increasing and positive cases have been declining. However, two observations are surprising and need a deeper look: one, deaths have not increased even as the number of positive cases rose precipitously; and two, the fatality rates reduced by a significant 33-35% for most of the age groups.
[Disclaimer: This article is a citizen contribution and the analysis is based on public information. Any views expressed here are those of the individual writer(s) and do not reflect the position of Citizen Matters.]
Wow ! Awesome insight. Well compiled, appreciate .
Superb article, but THE most important pieces in the Jigsaw is actual excess death & total actual infection,.
Both Will be hard to get in India, actual death can somehow be got from burial grounds, but sero surveys done in India are totally biased ( random survey in delhi says nearly 30% are infected but daily positivity rate for targeted people is less than 5%, they surveyed highly vunerable group and then overlapped the result to while Delhi ! )
Does it mean that virulence of the virus is reducing with passage of time ? If that is the case then government should be careful that no new strain of the virus is imported to cause flair up again.
Excellent article with in-depth analysis.
Some people always keep asking questions, even when things are improving. When deaths wee high they questions why it is high? When it is low, they questions why it is low?
It look like these people just running their shop using covid19 and don’t want this pendamic to get over, because if this is over they have to go out and do the hard work otherwise people will not read their articles.
Without being cynical, it is not for nothing that it is said that “statistics is a bundle of lies”. They are based on probable, variables, random samplings, etc. COVID19 has arrived and it is taking its toll. Most figures are those that have come to the notice of the authorities through their systems like testing, lab delays, absence of necessary infrastructure etc. Even now this exists in rural areas where there is rampant violations of guidelines like compulsory masking, for one, like wearing helmets (has anybody seen rural bike riders wearing helmet whereas in urban areas, police are making a killing?). This is unacceptable. At the end of the day, people have learnt to live with COVID and accept whatever happens to them as their fate. There is a saying in Kannada – “dinaa saayuvavarige aluvavaru yaaru?” (if there are deaths daily, who can keep on crying?). In the name of doing providing something relief to suffering masses, huge amount of public money is being spent. Another saying in Kannada – Huchu hengasina maduveli, undavane jaana. That is all. PERIOD.