So far, the rainy season of 2023 is breaking all sorts of records. According to the Indian Meteorological Department (IMD), in Bengaluru, April had a 54.3% rainfall deficit while May had 102% surplus rainfall.
May 2023 was the wettest May in 66 years. Meanwhile, June was in deficit, July had 6% excess rainfall and August was the driest it has ever been in 123 years. September is making up slightly for the previous month.
If all of this is making you want to go lie down, I sympathise. In little over a century, Bengaluru has become a much rainier city. However, significantly, the rains have also become much more unpredictable. We explored these trends in part 1 of this series.
What does deficit and excess mean?
IMD infers whether a place has received normal or excess rainfall or is in deficit by comparing the total amount of rainfall in a month or year to a baseline value called the Long Period Average or LPA. LPA is the average rainfall calculated over a long period of 30 years. This LPA is revised periodically to take more recent years into account. IMD’s latest LPA, 1990-2020, is 1077.1 mm.
The actual rainfall in a year is categorised in this manner: 60% or more than LPA = large excess; 20%
to 59% more than LPA = excess; 19% less or more than LPA = normal; 20% to 59% less than LPA = deficient; 60% to 99% less than LPA = large deficient.
If 2022 was a deluge, 2023 may be a damp squib. IMD suggests the city may see a deficit in total rainfall this year, though the extent of the deficit remains in question. Right now, it looks like the rains will be just enough to bring our infrastructure down but not enough to make the New York Times take notice.
Read more: Over 100 years of Bengaluru rains decoded
Why should this year be so different? Unpredictable weather is a hallmark of climate change and the planet’s increased warming. However, rainfall patterns in India, and across the world, are also impacted by climatic phenomena originating in the Pacific Ocean in South America.
El Nino and La Nina
In the 1600s, fishermen in South America began noticing unusually warm waters in the Eastern Pacific Ocean of the continent. Typically, trade winds carry warm water from the Pacific Ocean of the South American coast westwards towards Asia. The warm waters are replaced by cold waters that are pulled from the bottom of the ocean. This cold water attracts several commercially important fish and is vital for South American fisheries.
But sometimes these trade winds become weak and the warm water moves in the opposite direction, towards the West Coast of the US instead of Asia. This results in unusually warm water in the Pacific, especially around Christmas. South American fishermen called this event El Nino de Navidad, Spanish for the little boy of Christmas.
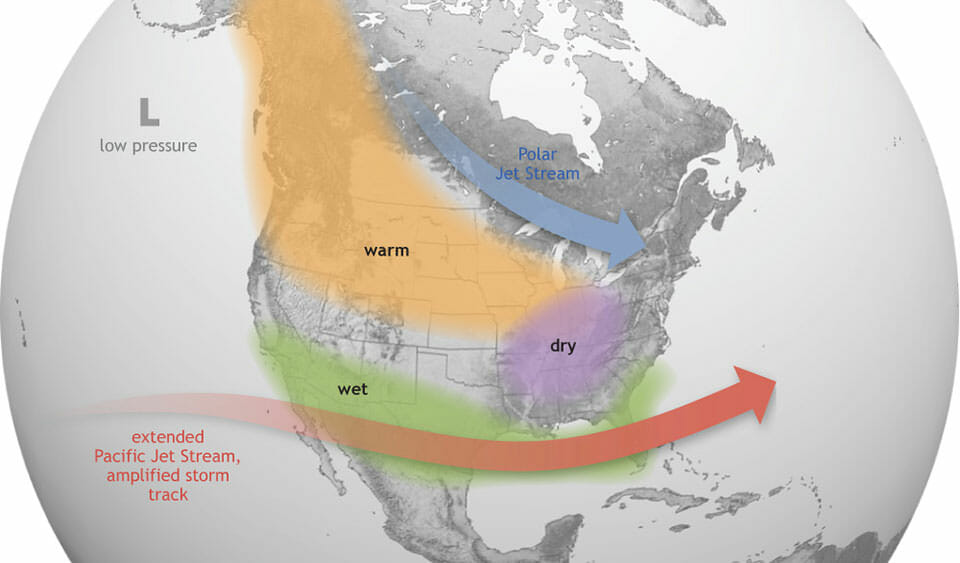
Ocean water temperature, atmospheric pressure and winds determine precipitation and other climatic conditions. When waters of the Eastern Pacific heat up instead of cooling down, they result in very high rainfall in places like the Southeast coast of the US. Studies suggest that in India, and other parts of Asia, El Nino results in droughts or shortage in rainfall.
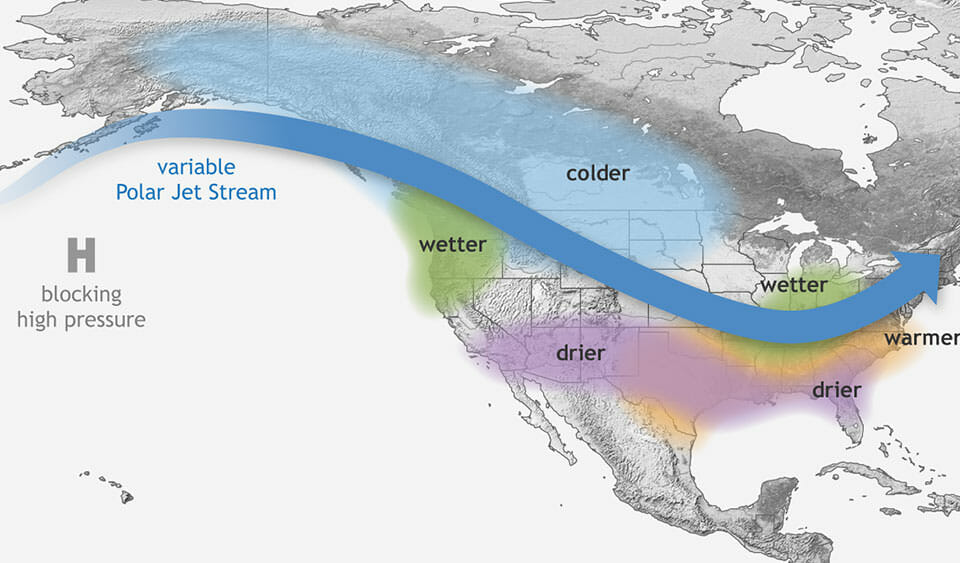
La Nina, Spanish for little girl, results in the opposite conditions. The trade winds are unusually strong and carry more warm water towards Asia, resulting in more cold water rising up in the Eastern Pacific off South America. La Nina is associated with higher rainfall in India.
Both climatic events are not fixed static events. El Nino, i.e., the warming, and La Nina, the cooling, develop over the course of a year. The strength of El Nino and La Nina events have also varied over the years.
You can read more about El Nino and La Nina here or check out this video.
El Nino, La Nina and Bengaluru over the years
Meteorologists predict that 2023 will be an El Nino year with the phenomena intensifying around December. Could El Nino be behind our low rainfall this year? While we cannot predict what will happen in 2023 until the year is over, we can look at whether past El Nino or La Nina events appear to be linked to rainfall in the city. As with part 1, we used IMD rainfall data from 1900-2022 for this analysis.
Read more: Bengaluru’s changing rainfall patterns: expert points to climate change
Overall rainfall
We looked at how much deviation there was in average rainfall during El Nino, La Nina and Neutral years between 1900 and 2022. As with part 1, we compared average rainfall over ten year blocks, i.e., 1900-1910, 1901-1911, 1902-1912, and so on.
Note: All the graphs show how much annual, seasonal or monthly rainfall has changed each year, 1900-2022, compared to the average rainfall of the ten preceding years.
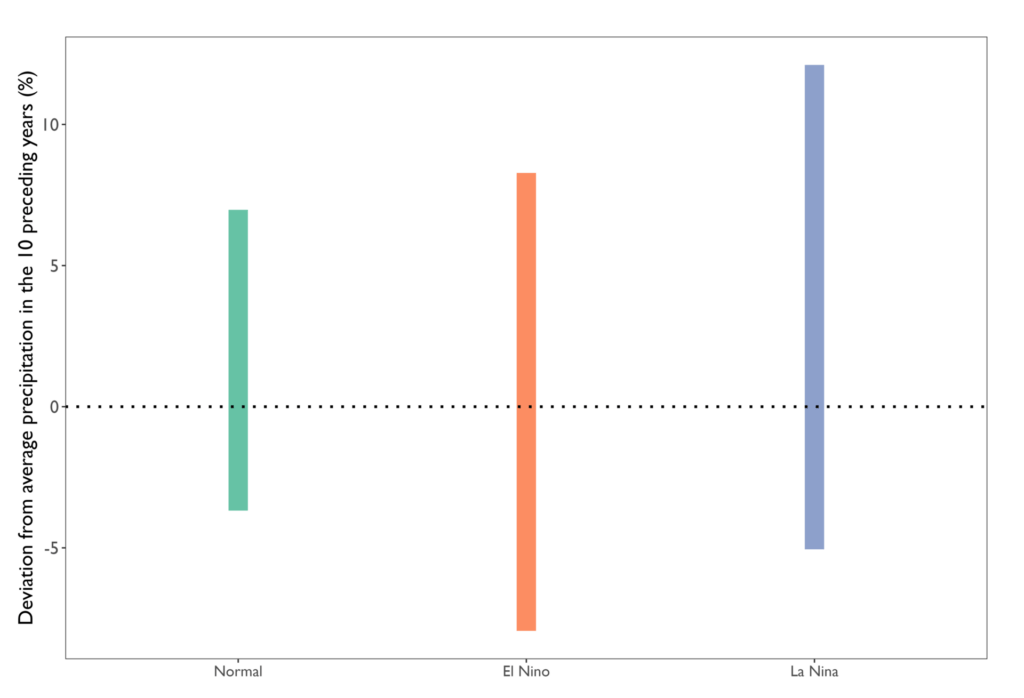
There have been at least 26 El Nino events since 1900 in Bengaluru. It appears that El Nino years do not lead to substantial decrease or increase in the total annual rainfall in Bengaluru. Although the La Nina years appear to result in excess rainfall, overall there is no pattern.
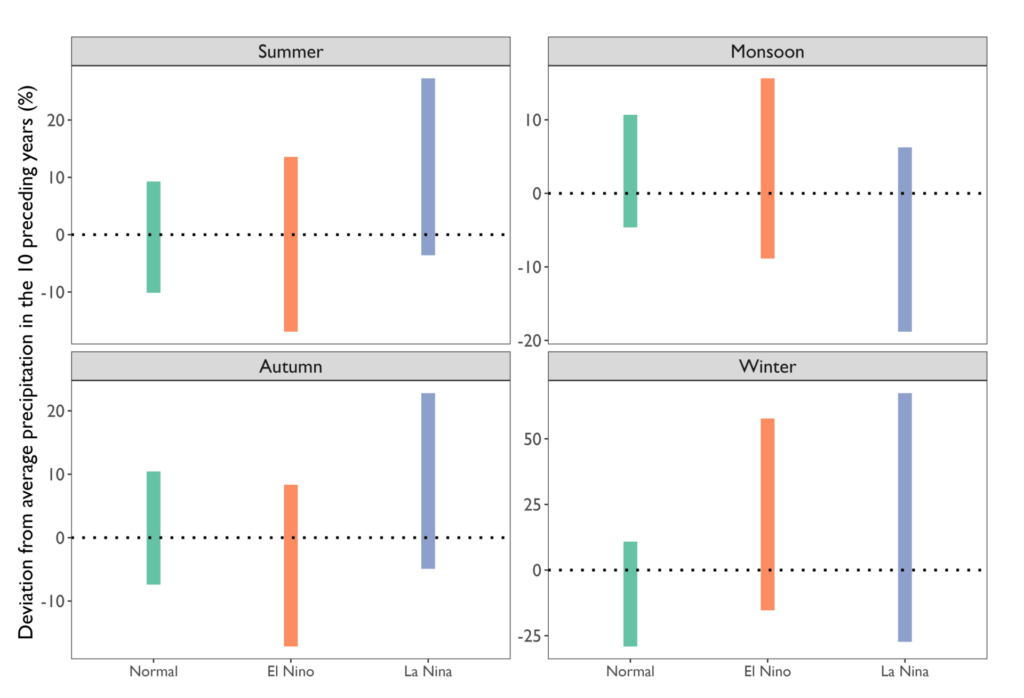
Seasonal and monthly patterns
Interestingly, El Nino and La Nina do not seem to even have an impact seasonally on rainfall in the city.
However, it gets much more interesting when we look at rainfall month-wise. As we have observed before, rainfall varies quite a bit month to month. El Nino is linked to deficits during the monsoon and even severe droughts in India.
In Bengaluru, El Nino appears to have the most impact in February, March and October. In an El Nino year, it appears certain that the city will experience a completely dry February and March. Even October, an extremely rainy month for the city, would be dry. In contrast, December always appears to receive above average (up to a 100% excess) rainfall in an El Nino year much more than neutral years.
During La Nina events, April and October experience excess rainfall. Even February, which is typically a very dry month, has experienced large excesses in rainfall (up to 200% more than the average). Interestingly, June, a monsoon month, experiences less than average rainfall during La Nina years. And in Bengaluru, you can only expect rainfall in March in a nice, neutral year.
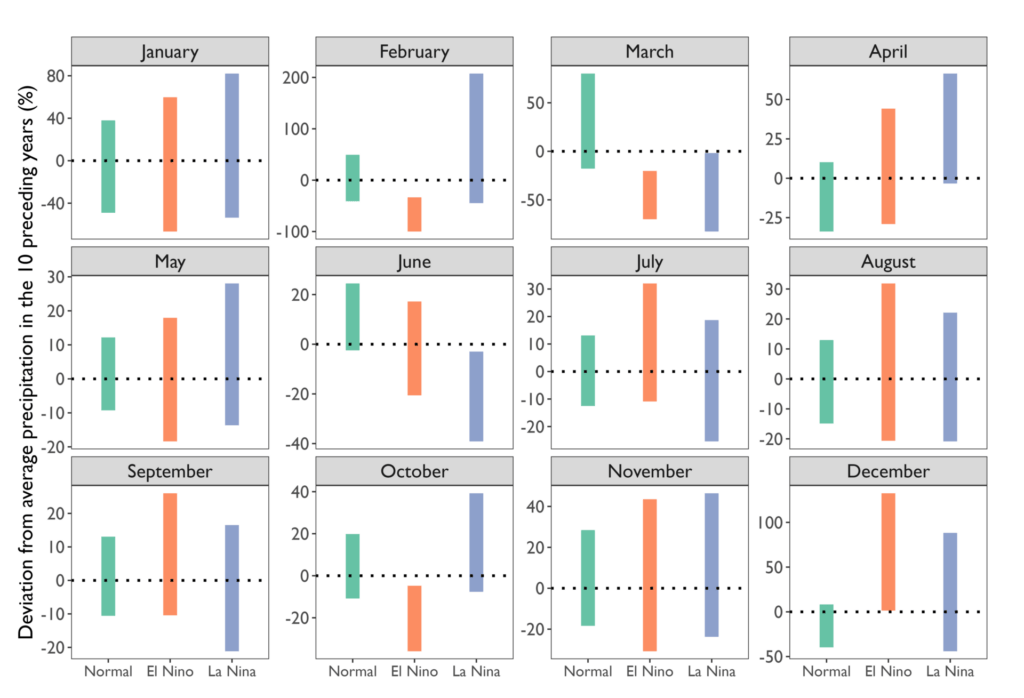
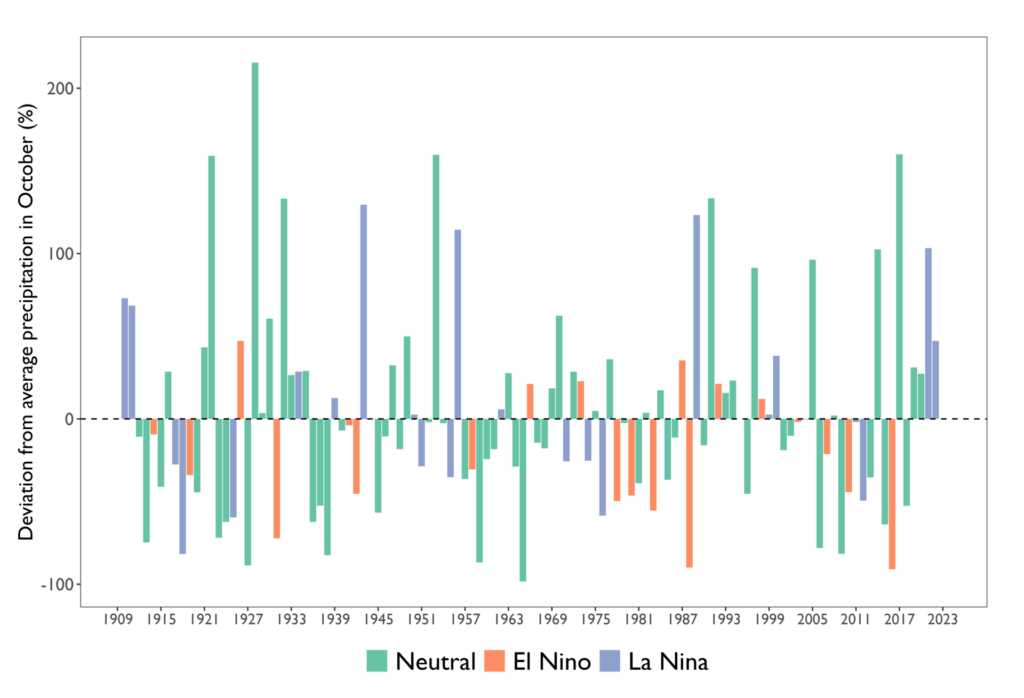
The impacts of La Nina and El Nino are most clear in October. Rainfall in October appears to be consistently less than average during El Nino years and consistently more than average during La Nina years.
Do El Nino and La Nina matter?
So, is rainfall this year in Bengaluru likely to be affected by El Nino? It’s difficult to say. Studies show that severe droughts in India have always occurred in El Nino years, but not all El Nino years result in severe droughts.
A 2023 study found that EL Nino had a stable negative effect on monsoon rainfall in South India, based on data from 1900-2018. This means, in the South, El Nino years are usually deficit years. Another study found that between 1900 and 2020, El Nino and La Nina effects are particularly strong in the coast and North East parts of Karnataka. The effects are not so evident for the rest of the state.
It is possible that Bengaluru will have deficit rainfall, or that the deficit will be made up in the subsequent months or that the city will have slightly lower than average rainfall.
These scenarios are not just academic ramblings but are related to Bangaloreans’ quality of life. How should the city be prepared for these climatic events, which can lead to floods or, as is currently happening, a shortage in water supply? What information do we need at the local level? We will explore these questions in part 3 of this series.
Ashwin Viswanathan did the statistical analysis for this article. Ashwin is a naturalist and ecologist.
Note: We used IMD grid data for rainfall. The complete dataset can be found on the urban data portal OpenCity.in. El Nino and La Nina years were taken from this NOAA site. Vaidya R. contributed to the data compilation.
Thank you for this very interesting analysis! In practical terms, it may provide some useful pointers for farming activities around Bengaluru.