With the absence of major rivers, floods in Bengaluru are caused only by rainfall. Knowing which are the months that are vulnerable to floods helps in taking necessary precautions.
Primary rainy season in the city is from June to September when Bengaluru receives rain from South-West Monsoon, and secondary rainy season is from November to December when it receives rain from North-East Monsoon.
Here is the raw data for rainfall in 100 years, from 1901 to 2000.
This exhaustive data is plotted in graphs for each month.
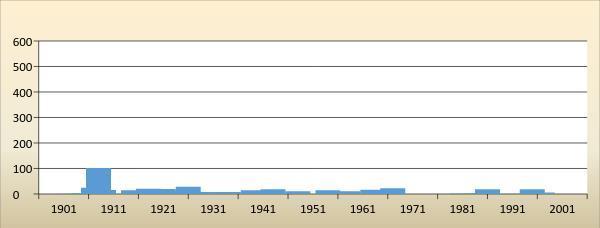
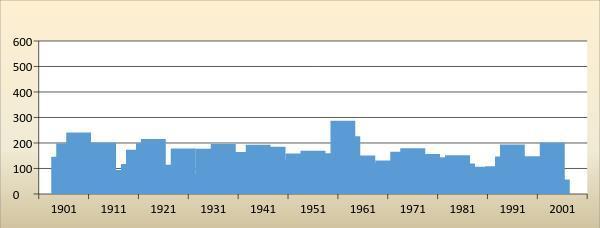
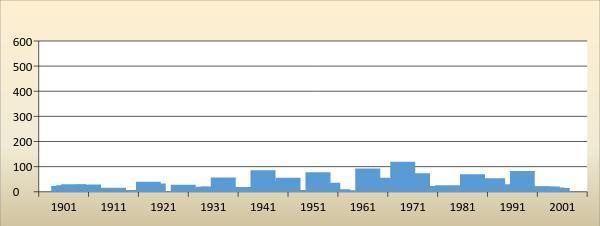
100 years rainfall graph for the month of January
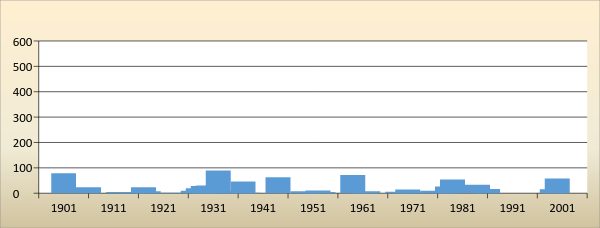
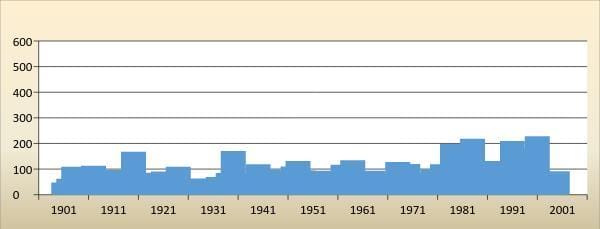
100 years rainfall graph for the month of February
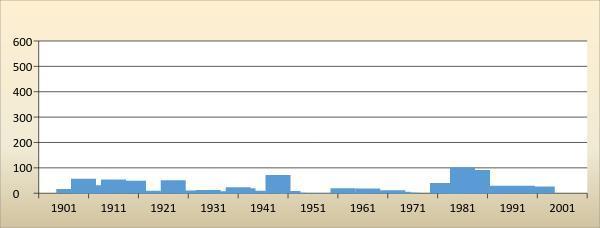
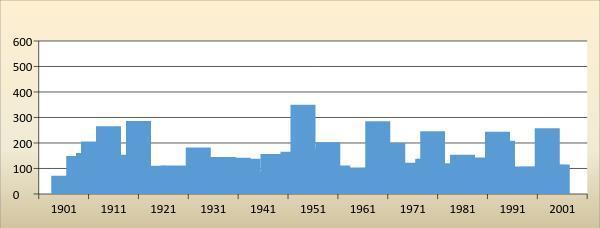
100 years rainfall graph for the month of March
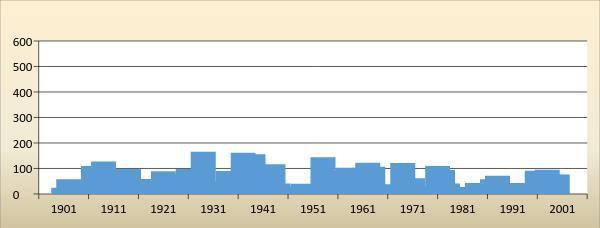
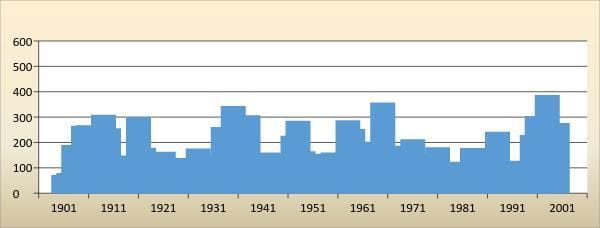
100 years rainfall graph for the month of April
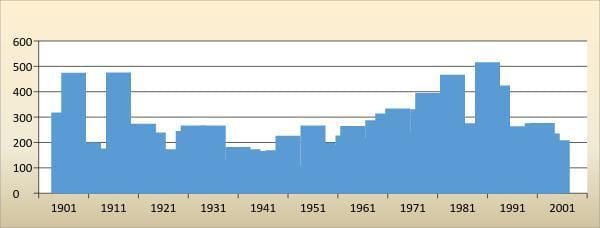
100 years rainfall graph for the month of May
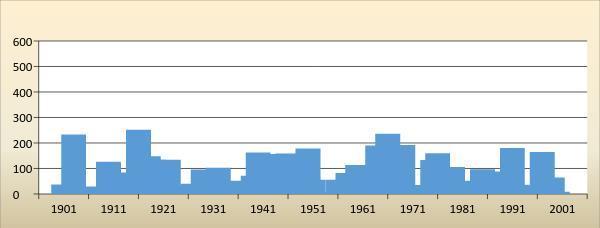
100 years rainfall graph for the month of June
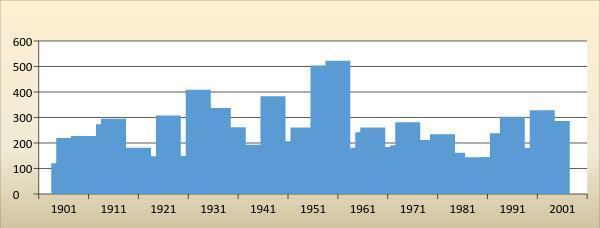
100 years rainfall graph for the month of July
100 years rainfall graph for the month of August
100 years rainfall graph for the month of September
100 years rainfall graph for the month of October
100 years rainfall graph for the month of Novermber
100 years rainfall graph for the month of December
Which month has more rains?
A frequency distribution map of rainfall for 100 years shows that September and October are the rainiest months in Bengaluru.
|
Months/Milestone readings |
Jan |
Feb |
Mar |
Apr |
May |
June |
July |
Aug |
Sept |
Oct |
Nov |
Dec |
|
0-49.9mm |
99 |
94 |
94 |
68 |
9 |
25 |
16 |
11 |
4 |
12 |
62 |
89 |
|
50-99.9mm |
0 |
6 |
5 |
20 |
40 |
54 |
35 |
29 |
15 |
16 |
17 |
10 |
|
100-149.9mm |
1 |
0 |
1 |
9 |
25 |
14 |
30 |
22 |
19 |
19 |
9 |
1 |
|
150-199.9mm |
0 |
0 |
0 |
3 |
20 |
4 |
9 |
18 |
21 |
27 |
9 |
0 |
|
200-249.9mm |
0 |
0 |
0 |
0 |
6 |
3 |
5 |
5 |
20 |
11 |
2 |
0 |
|
250-299.9mm |
0 |
0 |
0 |
0 |
0 |
0 |
4 |
8 |
11 |
7 |
1 |
0 |
|
300-349.9mm |
0 |
0 |
0 |
0 |
0 |
0 |
0 |
5 |
4 |
4 |
0 |
0 |
|
350-399.9mm |
0 |
0 |
0 |
0 |
0 |
0 |
1 |
2 |
1 |
1 |
0 |
0 |
|
400-449.9mm |
0 |
0 |
0 |
0 |
0 |
0 |
0 |
0 |
1 |
1 |
0 |
0 |
|
450-499.9mm |
0 |
0 |
0 |
0 |
0 |
0 |
0 |
0 |
3 |
0 |
0 |
0 |
|
500-549.9mm |
0 |
0 |
0 |
0 |
0 |
0 |
0 |
0 |
1 |
2 |
0 |
0 |
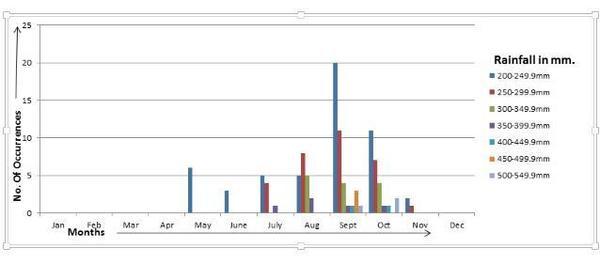
Graph of the monthly rainfall of above 250 mm.
What can we learn from the graphs?
- Highest rainfall occurs in Bengaluru in the months May, July, August, September and October with highest rainfall being 287, 350.2, 387.1, 516.6 and 522.2 respectively.
- Less rainfall occurs in the months of January, February, March, April, June, November and December with highest rainfall being 101.8, 89.9, 101.2, 165.6, 228, 252.2 and 119.2 respectively.
- Bengaluru receives on an average rainfall of 931 mm annually
- Primary rainy season is from June to October when Bengaluru receives rain from South-West Monsoon.
- Secondary rainy season is from November – December when it receives rain from North-East Monsoon.
- Though Bengaluru receives higher rainfall in five months of a year, the highest rainfall occurs in the months of August, September and October.
- So Bengaluru seems highly vulnerable for urban floods in the months of October, September and August, with September and October having the highest vulnerability.
- During the secondary rainy season and non-rainy reason, Bengaluru is considerably safe as there are less chances of heavy rainfall during these times. (There are exceptions though – November and December in 2015 were such exceptions, where there were unexpected high rains)
When is Bengaluru less likely to flood?
There are huge differences in the maximum rainfall in a month and the average rainfall of a month. For example, in the month of January where the highest rainfall is 101.8 mm, the average rainfall is just 4.87 mm. These misleading extreme values shall also be considered to obtain accurate analysis.
Generally the month of January hardly receives any rain, so, due to weather imbalance if one particular January receives some good rainfall, it deviates too much from the normal. In this case, the deviation is around 2090%. This is only an extreme event and does not make January month anywhere close to flood vulnerability generally. This can be observed from the graph as there are very few isolated tall lines.
Now we consider a month in primary monsoon, when Bengaluru receives rain from South-West monsoon. For example, August has had the highest rainfall of 387.1 mm. The average rainfall is 138.8 mm; the deviation of this extreme is only 278.9%. This means that the possibility of this extreme event or the event close to this extreme is very likely. This makes Bengaluru vulnerable for flood in the month of August. This can be observed from the graph as well where there are many tall lines close to each other.
More rain in the evenings
Most of the rainfall in the city occurs in the evening and night and rainfall before afternoon is very infrequent. This makes city more vulnerable for flooding in the evening than daytime.
If a month records very high rainfall, it does not always mean that there have been instances of flood during the month, because this amount of rainfall would have occurred over a period of few weeks.
On the other hand, a month that records relatively a low rainfall might have resulted in urban flood provided the major portion of this rainfall had occurred in a day or two. However, history demonstrates that the rainfall amount occurred in a month is directly proportional to the chances of urban flood occurrences.
Out of twelve months, only five months are identified to be flood vulnerable. Out of those three months namely August, September and October are considered highly vulnerable for flooding. Out of them October is most vulnerable.
With this analysis, it is possible to determine the months where the precautions are to be taken. Necessary actions may be initiated in the months of August, September and October so that the losses to lives and properties may be minimized and make sure that day to day life is not deeply disturbed.
Related Articles
Rainfall in Bangalore over the last century: Has it really changed?
100 years of rainfall data for Bengaluru
How is Bengaluru supposed to handle disasters like floods?
Why Bengaluru is not immune to floods: It’s all about land (and money)
Here’s how Bengaluru is becoming increasingly flood-prone